
|
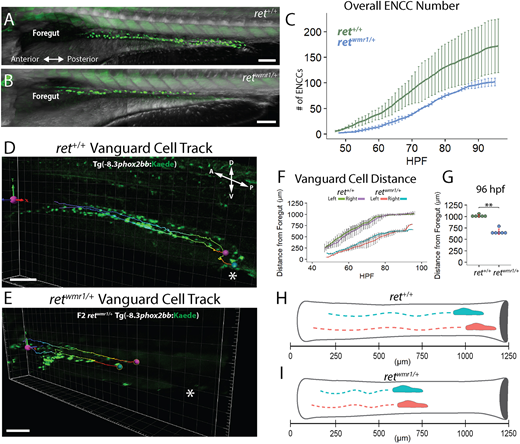
Fig. 3 retwmr1/+ fish display a reduction in total ENCC number and migratory extent along the gut. (A,B) Images of ret+/+ (A) and retwmr1/+ Tg(−8.3phox2bb:Kaede) (B) fish show phox2bb+ ENCCs within the intestine at 96 hpf. retwmr1/+ ENCCs fail to reach distal hindgut at 96 hpf. (C) Average number of ENCCs present during the 48-96 hpf time-lapse in ret+/+ and retwmr1/+ fish (n=3). (D,E) Snapshot of final 96 hpf time-point depicts migratory track of leading-edge cell (vanguard) in left (pink spot) and right (blue spot) ENCC chains (cloaca, white asterisk). (F) Average distance traveled by left and right vanguard cells in ret+/+ and retwmr1/+ fish compared across 48-96 hpf (n=6 per condition; data are mean±s.e.m.). (G) Final position of vanguard cells at 96 hpf (Wilcoxon signed-rank test, **P=0.0022). (H,I) Schematic depicts vanguard cells in left (pink) and right (blue) ENCC migratory chains in (H) ret+/+ and (I) retwmr1/+. Scale bars: 100 µm. A, anterior; D, dorsal; P, posterior; V, ventral.