
Fig. 6
- ID
- ZDB-IMAGE-231215-89
- Genes
- Publication
- Derrick et al., 2021 - Lamb1a regulates atrial growth by limiting second heart field addition during zebrafish heart development
- All Figures
- Figures for Derrick et al., 2021
|
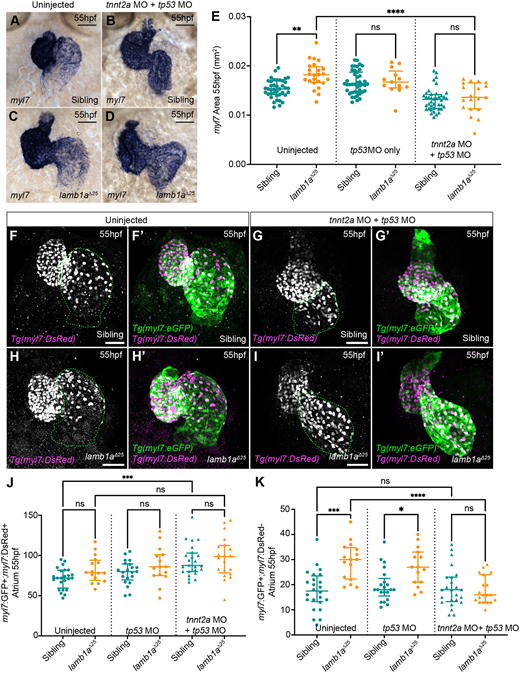
Fig. 6 Lamb1a limits excessive, contractility-dependent SHF addition to the venous pole. (A-D) mRNA in situ hybridisation analysis of myl7 expression in sibling (A,B) and lamb1aΔ25 mutant embryos (C,D) either uninjected (A,C) or injected with tp53 MO+tnnt2a MO (B,D). (E) Quantification of myl7 area in uninjected (sibling: n=40; lamb1aΔ25: n=24), tp53 MO-injected control (sibling: n=43; lamb1aΔ25: n=13) and tp53 MO+tnnt2a MO-injected (sibling: n=40; lamb1aΔ25: n=19) embryos at 55 hpf. Data are median±interquartile range, analysed with the Kruskal–Wallis test with multiple comparisons. (F-I′) Maximum intensity projections of confocal image z-stacks in Tg(myl7:eGFP);Tg(myl7:DsRed) double-transgenic sibling (F-G′) and lamb1aΔ25 mutant embryos (H-I′) at 55 hpf, either uninjected (F,F′,H,H′) or injected with tp53 MO+tnnt2a MO (G,G′,I, I′). Green dotted lines indicate the atrium. (J,K) Quantification of double GFP+;DsRed+ atrial cardiomyocytes (J) and GFP+;DsRed− SHF cells (K) at 55 hpf in siblings and lamb1a mutants either uninjected (sibling: n=24; lamb1aΔ25: n=16), injected with tp53 MO (sibling: n=21; lamb1aΔ25: n=15) or injected with tp53 MO+tnnt2a MO (sibling: n=24; lamb1aΔ25: n=20). Blocking heart contractility with the tnnt2a MO rescues excess SHF addition in lamb1a mutants (K). Data are median±interquartile range, analysed with Brown–Forsythe and Welch ANOVAs with multiple comparisons; ****P<0.0001, ***P<0.001, **P<0.01, *P<0.05, ns=not significant in all graphs. Scale bars: 50 μm.