
Fig. 3
- ID
- ZDB-IMAGE-231215-69
- Publication
- Jiang et al., 2020 - Tek/Tie2 is not required for cardiovascular development in zebrafish
- All Figures
- Figures for Jiang et al., 2020
|
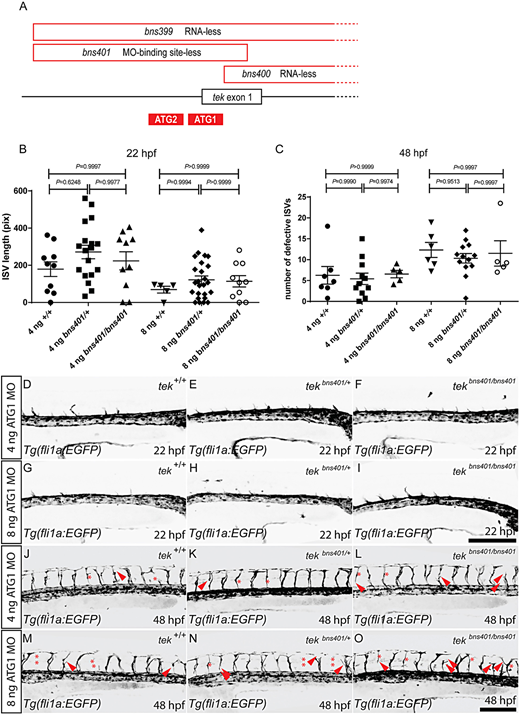
Fig. 3 tek MO injections into zebrafish embryos lacking the MO-binding site cause vascular phenotypes. (A) Schematic representation of the deletions in the tekbns399, tekbns400 and tekbns401 alleles, and the location of the tek ATG1 and ATG2 MOs (only the 5′ end of the tek locus is shown). (B) Total length of 10 intersegmental vessels (ISVs) above the yolk extension in 22 hpf tekbns401/+ incrossed embryos injected with 4 or 8 ng of tek ATG1 MO. (C) Number of defective ISVs above the yolk extension in 48 hpf tekbns401/+ incrossed embryos injected with 4 or 8 ng of tek ATG1 MO. (D-F) Lateral views of trunk vessels in 22 hpf tekbns401/+ incrossed embryos injected with 4 ng of tek ATG1 MO. (G-I) Lateral views of trunk vessels in 22 hpf tekbns401/+ incrossed embryos injected with 8 ng of tek ATG1 MO. (J-L) Lateral views of trunk vessels in 48 hpf tekbns401/+ incrossed embryos injected with 4 ng of tek ATG1 MO. (M-O) Lateral views of trunk vessels in 48 hpf tekbns401/+ incrossed embryos injected with 8 ng of tek ATG1 MO. Red arrowheads indicate abnormal ISV formation; red asterisks indicate absent ISVs. In B and C, data are mean±s.d. [one-way analysis of variance (ANOVA) followed by Tukey's HSD test]. Scale bars: 200 μm.