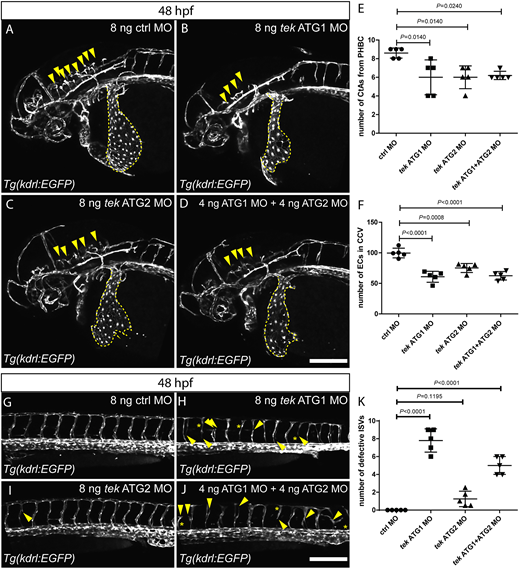
Fig. 2 Zebrafish tek morphants display reduced angiogenesis and abnormal CCV formation. (A-D) Lateral views of 48 hpf head vasculature in embryos injected with 8 ng of control MO (A), 8 ng of tek ATG1 MO (B), 8 ng of tek ATG2 MO (C) or 4 ng of tek ATG1 MO plus 4 ng of tek ATG2 MO (D). Yellow arrowheads indicate central arteries (CtAs); yellow dashed lines outline the common cardinal veins (CCVs). (E) CtA numbers in different MO-injected groups at 48 hpf. (F) Endothelial cell numbers in the CCVs in different MO-injected groups at 48 hpf. (G-J) Lateral views of 48 hpf trunk vessels in embryos injected with 8 ng of control MO (G), 8 ng of tek ATG1 MO (H), 8 ng of tek ATG2 MO (I) or 4 ng of tek ATG1 MO plus 4 ng of tek ATG2 MO (J). Yellow arrowheads indicate abnormal intersegmental vessel (ISV) formation; yellow asterisks indicate absent ISVs. (K) Number of defective ISVs above the yolk extension in different MO-injected groups at 48 hpf. In E,F and K, data are mean±s.d. [one-way analysis of variance (ANOVA) followed by Tukey's HSD test]. Scale bars: 200 μm.
Image
Figure Caption
Figure Data
Acknowledgments
This image is the copyrighted work of the attributed author or publisher, and
ZFIN has permission only to display this image to its users.
Additional permissions should be obtained from the applicable author or publisher of the image.
Full text @ Development

