IMAGE

Fig. 2

ID
ZDB-IMAGE-231215-215
Source
Figures for Kim et al., 2023
Image
Figure Caption

Fig. 2

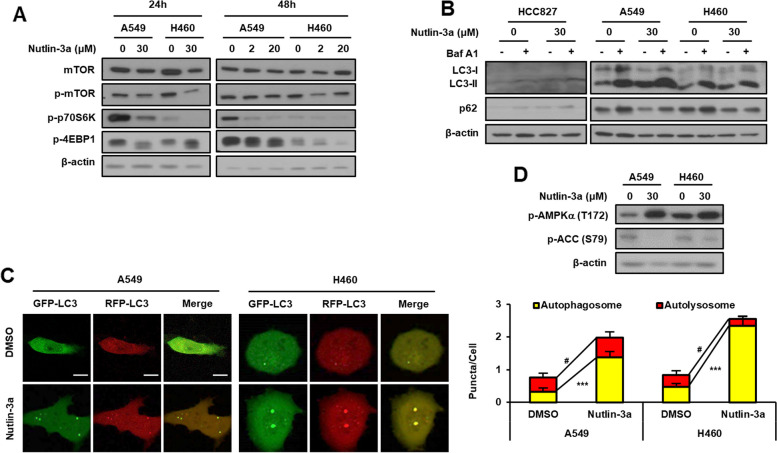
Nutlin-3a disrupts the fusion of autophagosomes and lysosomes in KRAS MT/p53 WT NSCLC cells. A Downregulation of the mTOR pathway detected by western blotting after nutlin-3a treatment. B Western blotting for the expression of autophagy markers performed after co-treatment of cells with bafilomycin A1 (100 nM) for 1 h in the presence or absence of nutlin-3a for 24 h. C Autophagy flux after cell treatment with nutlin-3a (30 μM) for 24 h after transfection of the mRFP-GFP-LC3 plasmid. Live cell imaging was obtained using a confocal laser scanning microscope (left), and number of puncta per cell were quantified from representative images (right) (n ≥ 21). D Western blotting for the expression of surrogate markers of the autophagic process, p-AMPKα, and p-ACC, performed after nutlin-3a (30 μM) for 24 h. Scale bar: 10 μm

Acknowledgments
This image is the copyrighted work of the attributed author or publisher, and ZFIN has permission only to display this image to its users. Additional permissions should be obtained from the applicable author or publisher of the image. Full text @ J. Exp. Clin. Cancer Res.