
Fig. 1
- ID
- ZDB-IMAGE-231215-164
- Genes
- Publication
- Dai et al., 2022 - Csf1rb regulates definitive hematopoiesis in zebrafish
- All Figures
- Figures for Dai et al., 2022
|
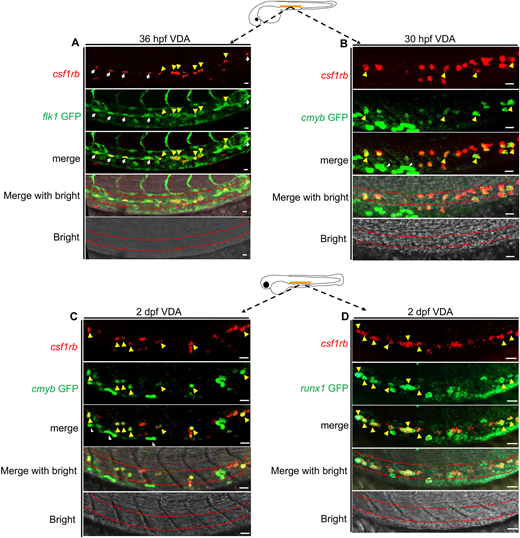
Fig. 1 Csf1rb is highly expressed in hemogenic endothelium and HSPCs. (A,B) Diagram at the top shows a 30-36 hpf zebrafish embryo; the orange line indicates the VDA region. (A) WISH of csf1rb in the Tg(flk1:GFP) line at 36 hpf in the VDA region. White arrows indicate colocalization of csf1rb (red) and GFP+ HE (green) with a flat shape. Yellow arrowheads indicate csf1rb-positive naïve HSPCs with a round shape. n=12. (B) WISH of csf1rb in the Tg(cmyb:GFP) line at 30 hpf in the VDA region. Yellow arrowheads indicate colocalization of csf1rb (red) and GFP+ HSPCs (green). White arrowheads indicate cmyb-GFP+ multiciliated cells. n=12. (C,D) Diagram at the top shows a 2 dpf zebrafish embryo; the orange line indicates the VDA region. (C) WISH of csf1rb in the VDA of Tg(cmyb:GFP) at 2 dpf. White arrowheads indicate cmyb-GFP+ multiciliated cells. n=12. (D) WISH of csf1rb in the VDA of Tg(runx1:en-GFP) at 2 dpf. Yellow arrowheads indicate colocalization of csf1rb (red) and GFP+ HSPCs (green). n=15. Brightfield images are two to five layers stacked to show the VDA region (indicated by the red dashed lines). Scale bars: 20 μm.