
Fig. 3
- ID
- ZDB-IMAGE-231215-151
- Publication
- Touret et al., 2022 - A dual involvement of Protocadherin-18a in stromal cell development guides the formation of a functional hematopoietic niche
- All Figures
- Figures for Touret et al., 2022
|
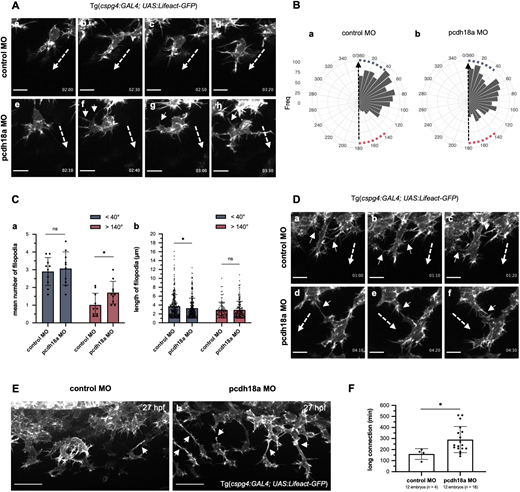
Fig. 3 Pcdh18a modulates cell protrusions and connections of migrating SCPs. (Aa-Ah) Time-lapse confocal images of migrating SCP leader cells from control and pcdh18a-ΔCP106 morphant Tg(cspg4:GAL4; UAS:Lifeact-GFP) embryos by 26 hpf (see also Movie 3), extracted at 20-30 min intervals. Time from initiation of SCP migration is shown in the lower right of each panel. Dashed and short arrows indicate the direction of SCP migration and filopodia extending in the opposite direction, respectively. Scale bars: 10 µm. (Ba,Bb) Quantification of the frequency of filopodia according to their angle relative to the direction of migration (dashed arrow) in control (Ba) and pcdh18a-ΔCP106 (Bb) morphant embryos. Angles <40° and >140° were considered close to the direction of the migration (blue squares) and opposite to the direction of migration (red squares), respectively. The linear mixed-effect model indicates that pcdh18a-ΔCP106 morphants have relative angles increased on average by 14.9° compared with controls (P=0.0041). (Ca) Quantification of the mean number of filopodia in sense (<40°, blue) or opposite direction (>140°, red) projected from migrating SCPs in control and pcdh18a-ΔCP106 morphant embryos. Each dot represents a biological replicate from five independent experiments (n=10 for controls and morphants) (mean±s.d.; ns, P=0.6666; *P=0.0284; unpaired, two-tailed Student's t-test). (Cb) Quantification of the length of filopodia in the sense (blue) or opposite (red) direction of cell migration. Each dot represents a single filopodium (n=392 for controls, 478 for pcdh18a morphants; mean±s.d.; ns, P=0.5190; *P=0.0247; Mann–Whitney test). (Da-Df) Time-lapse confocal images of migrating leader SCPs from control and morphant Tg(cspg4:GAL4; UAS:Lifeact-GFP) embryos around 25-28 hpf, extracted at 10 min intervals. In controls, neighboring leader cells interact by brief contact of their filopodia (Da-Dc, arrows), which do not change their direction of migration (dashed arrows), whereas in morphants they tend to have longer contacts (Dd-Df, arrows), which can change their trajectory. Scale bars: 10 µm. (Ea,Eb) Confocal spinning-disk images of live Tg(cspg4:GAL4; UAS:Lifeact-GFP) embryos at 27 hpf. Leader cells tend to show longer connections to follower cells (arrows) in morphants (Eb) compared with controls (Ea). Scale bars: 30 µm. (F) Quantification of the duration of long (>10 µm) cell connections between leader and follower cells (mean±s.d.; *P=0.0113; Mann–Whitney test). See also Movie 4.