
|
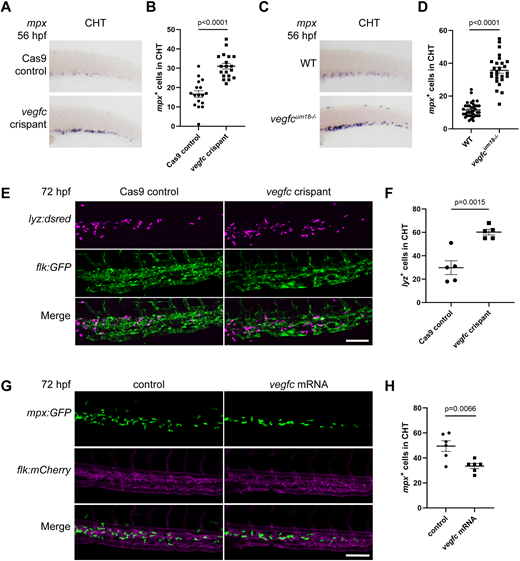
Fig. 3 vegfc loss-of-function embryos display an increase in myeloid cells in the CHT. (A) vegfc loss-of-function increases the number of mpx-expressing cells in the CHT region at 56 hpf. (B) Quantification of the number of mpx-expressing cells in the CHT at 56 hpf, P<0.0001 (unpaired two-tailed t-test). (C) vegfcum18−/− mutant embryos show increased mpx expression in the CHT at 56 hpf. (D) Quantification of the number of mpx-expressing cells in the CHT at 72 hpf, P<0.0001 (unpaired two-tailed t-test). (E) vegfc loss-of-function increases the number of lyz:DsRed2+ (magenta) cells in the CHT at 72 hpf. flk:gfp+ vessels are green. (F) Quantification of lyz:DsRed2+ cells within the CHT, P=0.0015 (unpaired two-tailed t-test). (G) Overexpression of vegfc decreases the number of mpx:gfp+ (green) cells in the CHT at 72 hpf. flk:mCherry+ vessels are magenta. (H) Quantification of the number of mpx-expressing cells in the CHT at 72 hpf, P=0.0066 (unpaired two-tailed t-test). Error bars show mean±s.e.m. Scale bars: 50 µm (E,G).