
Fig. 7
- ID
- ZDB-IMAGE-231215-126
- Publication
- Farmer et al., 2021 - Comprehensive series of Irx cluster mutants reveals diverse roles in facial cartilage development
- All Figures
- Figures for Farmer et al., 2021
|
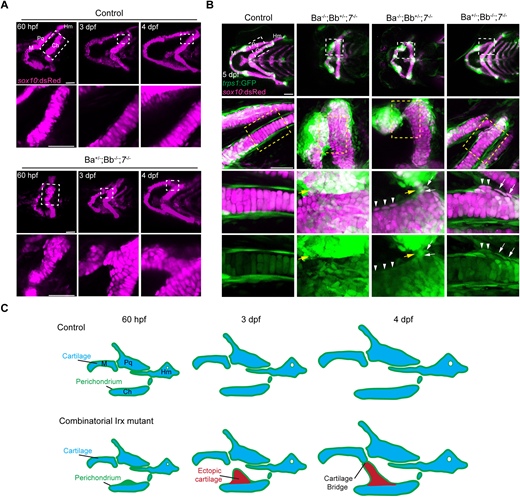
Fig. 7 Sequential in vivo imaging of cartilage fusion in Irx mutants. (A) Serial confocal imaging of sox10:dsRed+ facial cartilages in wild-type sibling controls and IrxBa+/−; IrxBb−/−; irx7−/− mutant embryos, with fusion regions indicated with dashed rectangles and magnified below. Ectopic chondrocytes are observed along the mutant ceratohyal cartilage at 60 hpf, which then expand to fuse with Meckel's cartilage by 4 dpf. (B) Confocal imaging of the cartilage marker sox10:dsRed and perichondrium marker trps1:GFP in control and three mutants with severe fusion, mild fusion, or ectopic outgrowth of ceratohyal without fusion. Boxed regions are magnified below, and the merged and single trps1:GFP channels are shown for the highest magnification. The fusion sites are shown by yellow arrows, trps1:GFPhigh; sox10:dsRed+ chondrocytes by white arrows, and trps1:GFPlow; sox10:dsRed+ chondrocytes by arrowheads. (C) Model for cartilage fusion in Irx mutants shows ectopic cartilage outgrowths from the perichondrium resulting in aberrant cartilage bridges between neighboring elements. Ch, ceratohyal; Hm, hyomandibula; M, Meckel's; Pq, palatoquadrate. Scale bars: 50 µm.