
|
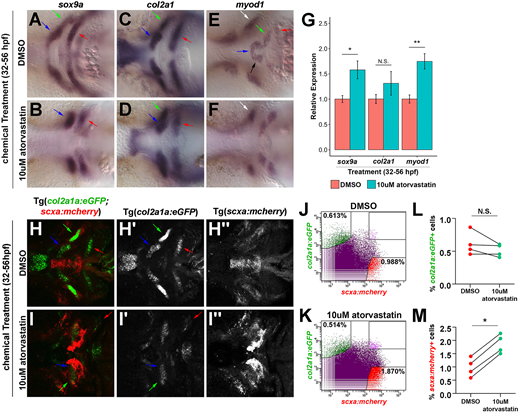
Fig. 3 Effect of statin on the craniofacial musculoskeleton. (A-F) Craniofacial expression of sox9a, col2a1 and myod1 at 56 hpf upon incubation from 32 to 56 hpf. At 56 hpf, atorvastatin altered the spatial expression patterns of sox9a (A,B), col2a1 (C,D) and myod1 (E,F) compared with controls. Arrows in A-D,H-I′ mark Meckel's cartilage (blue), palatoquadrate cartilage (green) and ceratohyal cartilage (red). Arrows in E,F mark intermandibularis anterior (blue), intermandibularis posterior (black), interhyal (green), hyohyal (red) and adductor mandibularis (white). (G) qPCR quantification revealed that atorvastatin increased sox9a and myod1 expression, but not col2a1 at 56 hpf after incubation from 32 to 56 hpf compared with controls. n=3, whole embryo, Welch's two-tailed t-test. Data are mean±s.d. (H,I) Craniofacial expression of col2a1a:eGFP;scxa:mcherry at 56 hpf upon incubation from 32 to 56 hpf. Corresponding views of eGFP (H′,I′) and mcherry (H″,I″). (J,K) Representative flow cytometry analysis of mcherry+ tendon and eGFP+ cartilage cells at 56 hpf in the head region of Tg(scxa:mcherry;col2a1a:eGFP) embryos after incubation from 32 to 56 hpf. Atorvastatin expanded mcherry+ tendon progenitors (0.988% in DMSO; 1.870% in atorvastatin). (L,M) Flow cytometry quantification of eGFP+ and mcherry+ cells at 56 hpf in the head region of Tg(scxa:mcherry;col2a1a:eGFP) embryos after incubation from 32 to 56 hpf. Atorvastatin increased mcherry+ cells but not eGFP+ cells (n=4; Mann–Whitney-Wilcoxon test). N.S., no significance; *P<0.05; **P<0.01. Ventral views (A-F,H-I″), anterior towards the left.