
IMAGE
Figure 5.
- ID
- ZDB-IMAGE-231212-46
- Publication
- Singh et al., 2023 - NMJ analyser: a novel method to quantify neuromuscular junction morphology in zebrafish
- All Figures
- Figures for Singh et al., 2023
Image
|
Figure Caption
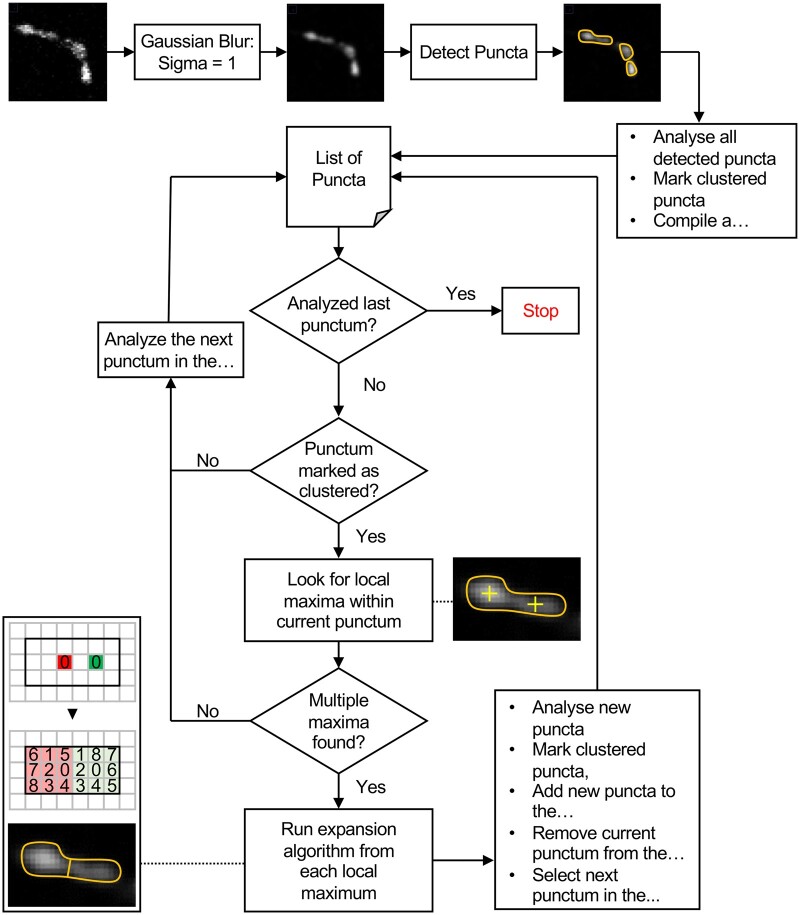
Figure 5.
Flowchart of Segmentation Algorithm. The segmentation algorithm compiles a list of all detected puncta into a list, marking the clustered puncta. If a clustered punctum can be segmented, the segmented puncta are added to the list, the original punctum is removed from the list, and the next punctum in the list is analysed. If a punctum cannot be segmented or was not marked as a clustered, the next punctum in the list is analysed. These steps are repeated until all puncta have been analysed.
Acknowledgments
This image is the copyrighted work of the attributed author or publisher, and
ZFIN has permission only to display this image to its users.
Additional permissions should be obtained from the applicable author or publisher of the image.
Full text @ Bioinformatics