IMAGE

Fig. 4

ID
ZDB-IMAGE-231211-60
Source
Figures for Ren et al., 2023
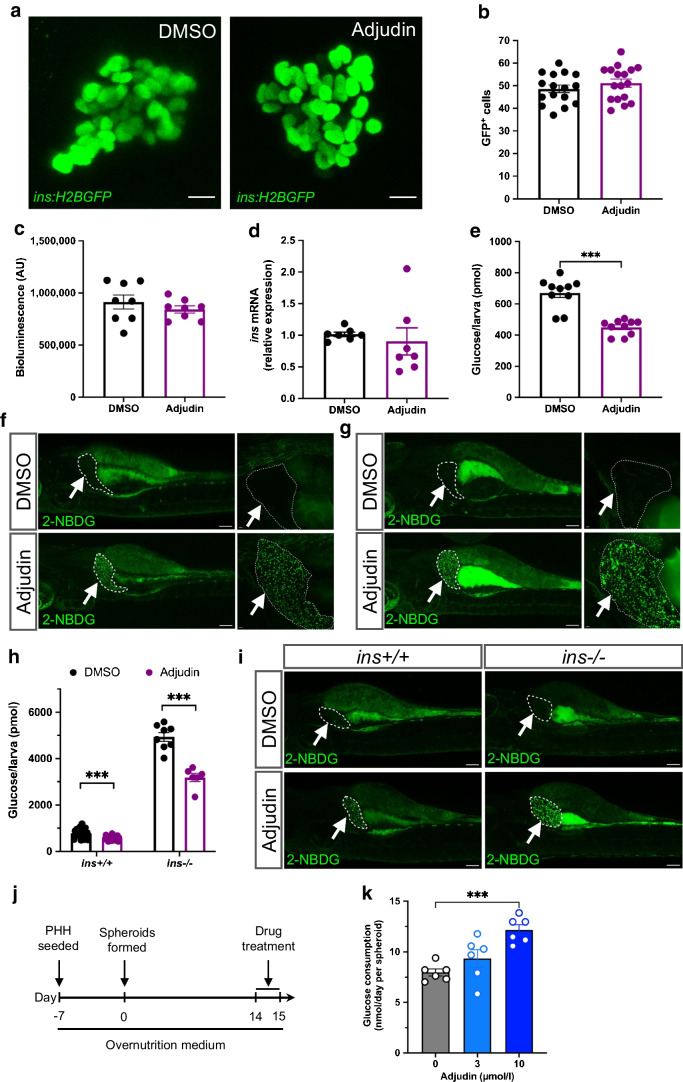
Image
Figure Caption

Fig. 4

Adjudin stimulates glucose uptake in the zebrafish liver and in human liver spheroids. (a) Maximum projections of primary islets in zebrafish larvae in the basal state (i.e. in the absence of beta cell ablation). Tg(ins:H2BGFP) larvae were treated with DMSO or 5 µmol/l adjudin for 2 days and fixed at 6 dpf for analysis. Scale bar, 10 μm. (b) Quantification of total number of beta cells in zebrafish larvae in the basal state (a). Mann–Whitney test. n=16 larvae (DMSO), n=17 larvae (adjudin). Data are presented as mean ± SEM. (c) Bioluminescence of zebrafish larvae in the basal state. Tg(ins:NLuc) larvae were treated with DMSO or 5 µmol/l adjudin for 1 day, and the luciferase assay was performed at 5 dpf. Mann–Whitney test. n=8 larvae per treatment. Data are presented as mean ± SEM. (d) qPCR analysis of ins expression in zebrafish larvae in the basal state. Wild-type zebrafish larvae were treated with DMSO or 5 µmol/l adjudin for 1 day before being analysed by qPCR at 5 dpf. Mann–Whitney test. n=65 larvae per treatment (5–12 larvae per data point). Data are presented as mean ± SEM. (e) Free glucose levels in zebrafish larvae in the basal state. Zebrafish larvae were treated with DMSO or 5 µmol/l adjudin for 2 days, and the free glucose levels were analysed at 6 dpf. Mann–Whitney test. ***p<0.001. n=10 larvae per treatment. Data are presented as mean ± SEM. (f) Glucose uptake indicated by 2-NBDG. Zebrafish larvae were pretreated with 5% glucose for 1 day, followed by treatment with DMSO or 5 µmol/l adjudin for 1 day, then 20 µmol/l 2-NBDG was added at the end of the treatment and the fluorescence analysed at 6 dpf. Livers of the larvae are outlined by white dashed lines and pointed to by white arrows. Scale bar, 100 µm (left panel); scale bar, 10 µm (right panel). (g) Glucose uptake indicated by 2-NBDG in zebrafish during beta cell regeneration. Tg(ins:Flag-NTR) zebrafish larvae were treated with DMSO or 5 µmol/l adjudin for 1 day following beta cell ablation, then 20 µmol/l 2-NBDG was added at the end of the treatment and the fluorescence signals were analysed at 5 dpf. Livers of the larvae are outlined by white dashed lines and pointed to by white arrows. Scale bar, 100 µm (left panel); scale bar, 10 µm (right panel). (h) Free glucose levels in ins +/+ and ins −/− larvae. ins +/− zebrafish were incrossed to generate ins +/+ and ins −/− larvae. The larvae were treated with DMSO or 5 µmol/l adjudin for 2 days from 3 to 5 dpf prior to analysis of free glucose levels. Mann–Whitney test: ***p<0.001. n=19 larvae (ins +/+, DMSO), n=19 larvae (ins +/+, adjudin), n=8 larvae (ins −/−, DMSO), n=6 larvae (ins −/−, adjudin). Data are presented as mean ± SEM. (i) Glucose uptake indicated by 2-NBDG in ins+/+ (left panel) and ins−/− (right panel) zebrafish. The zebrafish larvae were treated with DMSO or 5 µmol/l adjudin for 1 day, then 20 µmol/l 2-NBDG was added at the end of the treatment and the fluorescence signals were analysed at 5 dpf. Livers of the larvae are outlined by white dashed lines and pointed to by white arrows. Scale bar, 100 µm. (j) Schematic showing the timeline of experiments using PHHs. The PHHs were seeded to form spheroids and conditioned in overnutrition medium for 3 weeks to induce insulin resistance prior to treatment with DMSO, 3 µmol/l adjudin or 10 µmol/l adjudin. The glucose level in the medium was measured before and after the treatment. (k) Glucose consumption of the PHH spheroids treated as described in (j). One-way ANOVA followed by Dunnett’s multiple comparisons test: ***p<0.001. n=6 independent biological replicates per treatment. Data are presented as mean ± SEM. AU, arbitrary units

Acknowledgments
This image is the copyrighted work of the attributed author or publisher, and ZFIN has permission only to display this image to its users. Additional permissions should be obtained from the applicable author or publisher of the image. Full text @ Diabetologia