
|
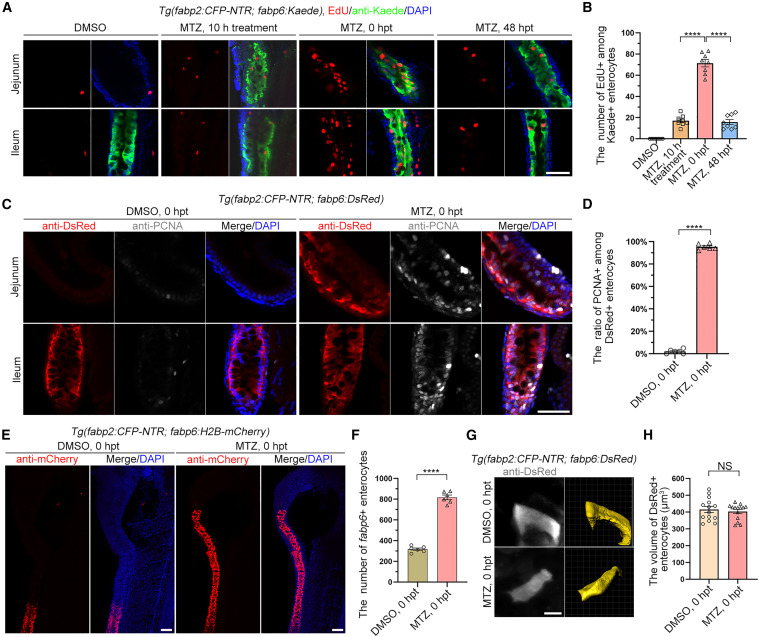
Fig. 2 Ileal enterocytes proliferate after jejunal damage (A) In the uninjured control, the ileal enterocytes rarely underwent mitosis. By contrast, with MTZ treatment from 10 h to 0 hpt, the EdU+ enterocytes gradually increased and then decreased at 48 hpt. (B) Graph showing quantification of EdU+ cells among Kaede+ enterocytes (n = 8). Data are presented as mean ± SEM. ∗∗∗∗p < 0.0001, two-tailed unpaired t test. (C) In contrast to uninjured intestine, the fabp6+ enterocytes of injured intestine highly expressed PCNA at 0 hpt. (D) Graph showing quantification of ratio of PCNA+ among DsRed+ enterocytes (n = 6). Data are presented as mean ± SEM. ∗∗∗∗p < 0.0001, two-tailed unpaired t test. (E) Compared with DMSO treatment, fabp6+ enterocytes increased cell number after intestinal injury. (F) Graph showing quantification of number of fabp6+ enterocytes (n = 6). Data are presented as mean ± SEM. ∗∗∗∗p < 0.0001, two-tailed unpaired t test. (G) Cell size of fabp6+ enterocytes during MTZ treatment. (H) Graph showing quantification of volume of fabp6+ enterocytes (n = 14). Data are presented as mean ± SEM. Not significant (NS), two-tailed unpaired t test. Scale bars, 5 μm (G) and 50 μm (A, C, and E)