Figure Caption
Fig. 3
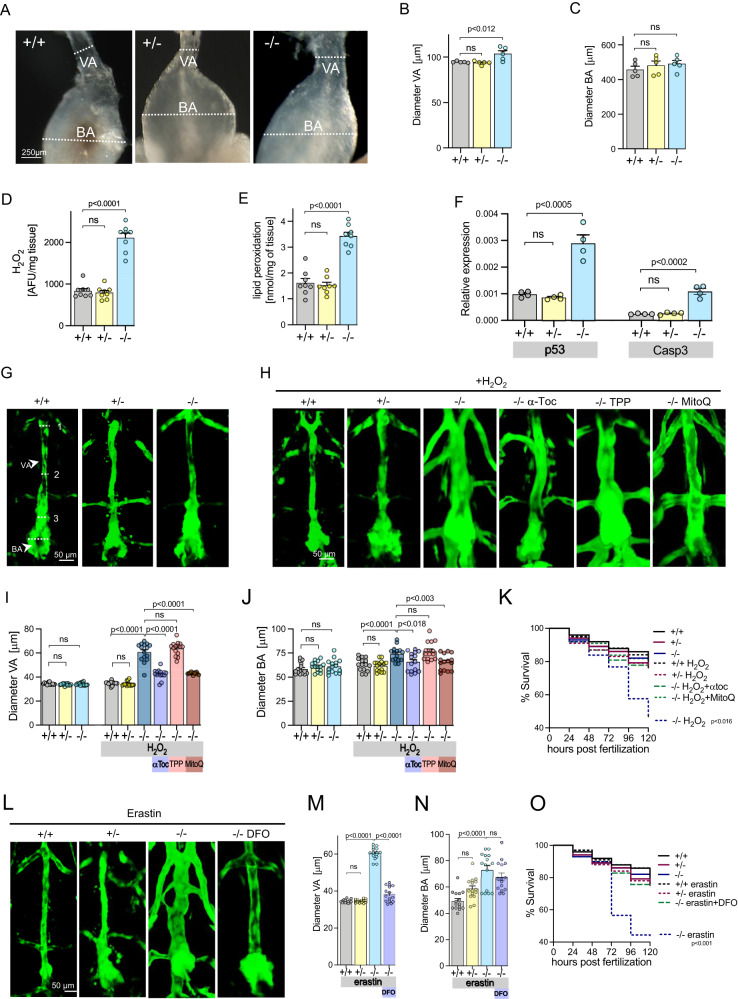
Aortic abnormalities in Secisbp2 mutant zebrafish.
A Representative aortic outflow tract images, comprising ventral aorta (VA) and bulbus arteriosus (BA), from wild-type (Secisbp2wt/wt; +/+), heterozygous (Secisbp2Q333X/wt; +/−) and homozygous (Secisbp2Q333X/Q333X; −/−) mutant adult (age 6 months) zebrafish. The dotted lines show the positions of VA and BA measurements quantified in (B and C). Each image was repeated independently 5 times with similar results. Scale bar: 250 μm. B and C VA and BA diameters, adjusted for body size, measured at dotted line positions in (A), in wild-type (+/+: grey bar), heterozygous (+/−: yellow bar) and homozygous (−/−: blue bar) Secisbp2 mutant fish. Statistics: Unpaired, two-tailed t-test, each bar represents the mean (n = 5), and error bars represent SD. D–F H2O2 (D, n = 8), lipid peroxidation (E, n = 8) and p53/casp3 mRNA expression (F, n = 4) in VA/BA tissue from wild type (+/+: grey bar), heterozygous (+/−: yellow bar) and homozygous (−/−: blue bar) Secisbp2 mutant fish. Statistics: unpaired, two-tailed t-test, each bar represents the mean, and error bars represent SD. G, H and L. Representative images, of the ventral aorta (VA) and bulbus arteriosus (BA) from wild-type (Secisbp2wt/wt; +/+), heterozygous (Secisbp2Q333X/wt; +/−) and homozygous (Secisbp2Q333X/Q333X; −/−) zebrafish embryos at 5 dpf. Images show vascular endothelial cell-specific green fluorescent protein, VA diameter and BA diameter was measured at positions (1–3) marked with broken line (G, +/+). Zygotes were treated (from 3 to 120 hpf) with 0.5 mM H2O2 or H2O2 + 1 mM α-tocopherol (αToc) or H2O2 + 1 mM Decyltriphenylphosphonium (TPP) or H2O2 + 1 mM MitoQ (H) or treated (from 6 to 120 hpf) with 10 mM Erastin or 10 mM Erastin + 100 mM desferrioxamine (DFO) (L). Each image was acquired independently fifteen times, with similar results. Scale bars: 250 μm. I and J Mean VA diameter, measured at positions (1–3) marked in (A) (I), or BA diameter (J) quantified in different groups (5 dpf, n = 15) in wild-type (Secisbp2wt/wt; +/+), heterozygous (Secisbp2Q333X/wt; +/−), homozygous (Secisbp2Q333X/Q333X; −/−) fish, untreated or treated with 0.5 mM H2O2 in combination with 1 mM α-tocopherol (αToc) or 1 mM Decyltriphenylphosphonium (TPP) or 1 mM MitoQ. Statistics: unpaired, two-tailed t-test, each bar represents the mean and error bars represent SD. K Percent survival of embryos over time in different groups described in (G–J). Statistics: Logrank test for trend (Chi-square), p-value for H2O2 treated Secisbp2Q333X/Q333X (−/−) versus all comparisons, each line represents the % of surviving fish (n = 100–200). M and N Mean VA diameter, measured at positions (1–3) marked in (A) (M), or BA diameter (N) quantified in different groups (5 dpf, n = 15) in wild-type (Secisbp2wt/wt; +/+), heterozygous (Secisbp2Q333X/wt; +/−), homozygous (Secisbp2Q333X/Q333X; −/−) fish, all treated with 10 mM Erastin or with 10 mM Erastin + 100 mM desferrioxamine (DFO). Statistics: unpaired, two-tailed t-test, each bar represents the mean, error bars represent SD. O Percent survival of embryos over time in different groups described in (L–I). Statistics: Logrank test for trend (Chi-square), the p-value for elastin-treated Secisbp2Q333X/Q333X (−/−) versus all comparisons, each line represents the percentage of surviving fish (n = 100–200). Source data are provided as a Source Data file.
Acknowledgments
This image is the copyrighted work of the attributed author or publisher, and
ZFIN has permission only to display this image to its users.
Additional permissions should be obtained from the applicable author or publisher of the image.
Full text @ Nat. Commun.