
|
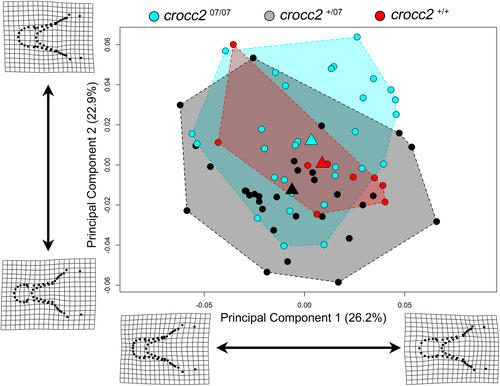
Fig. 3 Principal component analysis of 7 dpf zebrafish larvae illustrates increased variability and deviation of mean shape in crocc207/07. (A) Genotypes are color-coded (cyan = crocc207/07, black = crocc2+/07, red = crocc2+/+), circles represent individual specimens, triangles represent group means, and convex hull boundaries represent the outermost regions of morphospace occupied by each genotype. Deformation grids represent variation described by each axis. For example, PC1 captures variation in relative mandible length, while PC2 involves variation in pharyngeal skeletal width. Note that the proportion of variation explained by each axis is relatively similar at 7 dpf. Statistical results are detailed in Table S1.