
|
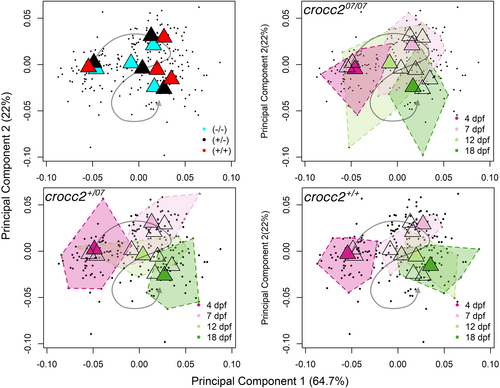
Fig. 2 Trajectory analysis of larval zebrafish with different crocc2 genotypes. Dark points represent individual specimens, colored triangles represent the mean shape of genotype:age groups. Top left illustrates the mean paths (gray arrow) of all three genotypes (mutant, cyan = crocc207/07, heterozygous, black = crocc2+/07, wild-type, red = crocc2+/+), with time periods progressing from 4 dpf to 18 dpf along the pathway. Note the differences in genotypic mean shapes, especially at 7 and 12 dpf. The remaining three panels highlight morphospace occupancy, for each genotype, throughout early ontogeny. The colors represent the age of the specimens (magenta = 4 dpf, light pink = 7 dpf, light green = 12 dpf, darker green = 18 dpf). While the general path is the same, note that crocc207/07 animals occupy a greater amount of morphospace compared to wild-type siblings, particularly along PC2. Statistical results are detailed in Table S1.