
|
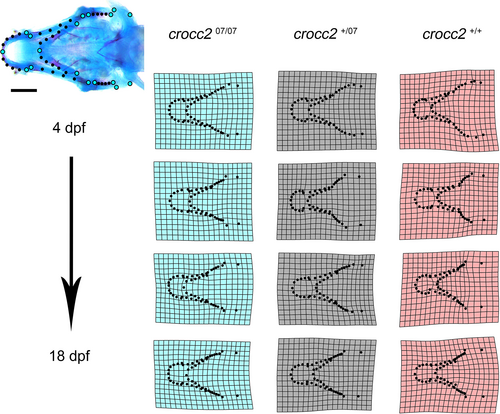
Fig. 1 Deformation grids suggest differences in the mean shape of larval zebrafish pharyngeal skeletons across crocc2 genotypes. Each genotype (mutant, cyan = crocc207/07, heterozygous, gray = crocc2+/07, wild-type, red = crocc2+/+) is represented by a specific color that can be matched to all geometric morphometric analyses presented here. Rows represent 4 dpf (top), 7 dpf, 12 dpf, and 18 dpf (bottom). Deformation grids are aligned along the center of their standalone axis for accurate interpretation of morphological differences. Landmark configuration is shown on a cleared and stained 18 dpf larval zebrafish. The cyan dots (larger dots) represent fixed landmarks and the black dots are semi-landmarks. Statistical results are detailed in Table S1. Scale bar equals 200 μm.