IMAGE

FIGURE 5

ID
ZDB-IMAGE-231130-56
Source
Figures for Belmonte-Mateos et al., 2023
Image
Figure Caption

FIGURE 5

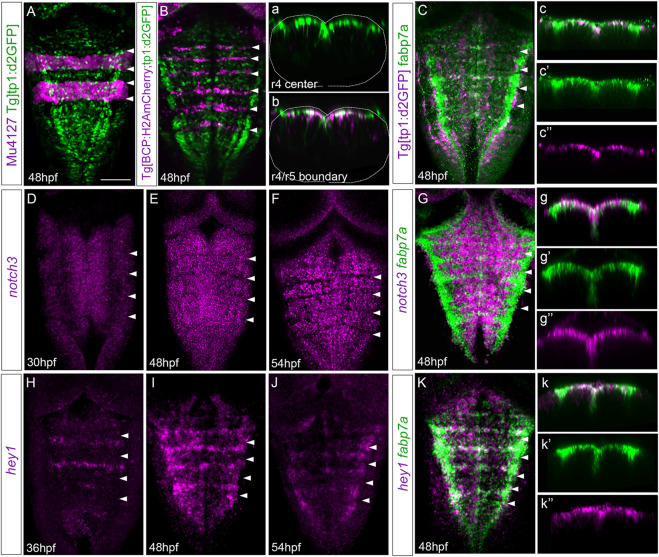
Rhombomere centers display Notch activity. (A,B) Mu4127 Tg[tp1:d2GFP] and Tg[BCP:H2AmCherry; tp1:d2GFP] embryos as the readout of Notch activity (green) with r3 and r5 or boundaries (magenta) as landmarks at 48 hpf. (a,b) Transverse views of (A,B) through the center of r4 or the r4/r5 boundary. Dotted lines indicate the contour of the neural tube. (C) Tg[tp1:d2GFP] embryos displaying Notch activity (magenta) and immunostained with fabp7a (green) at 48 hpf. (c–c’’) Transverse view of (C) showing only the ventricular domain through the center of r4 displaying either both channels (c) or single channels (c’–c’’). (D–G) Wild-type embryos in situ hybridized either with notch3(D–F) or notch3 and fabp7a(G) at the indicated stages. (g–g’’) Transverse view of (G) showing only the ventricular domain through the center of r4 displaying either both channels (g) or single channels (g’–g’’). (H–K) Wild-type embryos were in situ hybridized either with hey1(H–J) or hey1 and fabp7a(K) at the indicated stages. (k–k’’) Transverse view of (K) showing only the ventricular domain through the center of r4 displaying either both channels (k) or fabp7a or hey1(k’–k’’). (A–K) Dorsal MIP with anterior to the top. White arrowheads indicate the rhombomere boundaries. Scale bar, 50 μm.

Acknowledgments
This image is the copyrighted work of the attributed author or publisher, and ZFIN has permission only to display this image to its users. Additional permissions should be obtained from the applicable author or publisher of the image. Full text @ Front Cell Dev Biol