IMAGE

FIGURE 1

ID
ZDB-IMAGE-231130-47
Source
Figures for Belmonte-Mateos et al., 2023
Image
Figure Caption

FIGURE 1

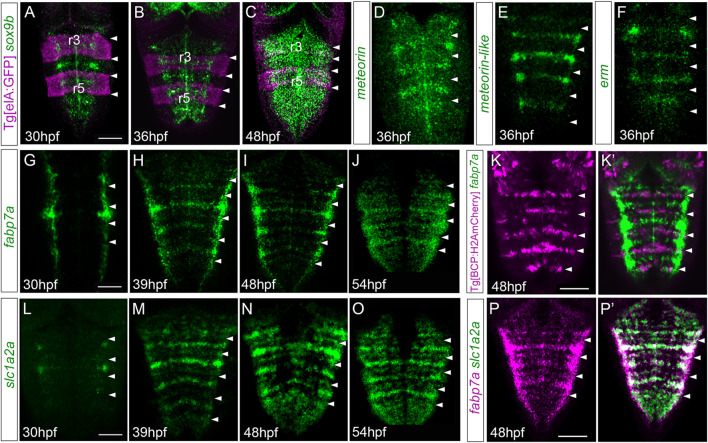
Hindbrain rhombomere centers display a specific combination of gene expression. (A–C) Tg[elA:GFP], (D–J,L–P,P’) wild type, or (K,K’) Tg[BCP:H2AmCherry] embryos at the indicated embryonic stages were in situ hybridized with sox9(A–C), meteorin(D), meteorin-like(E), erm(F), fabp7a(G–K,K’,P,P), and slc1a2a(L–P, P’). Images are displayed as the single gene expression channel (D–K, L–P) or the overlay of the two corresponding channels (A–C, K’, P’). All images are dorsal maximal intensity projections (MIP) with anterior to the top. White arrowheads indicate the rhombomeric boundaries. Note the enrichment of several markers in rhombomere centers. r3 and r5, rhombomeres 3 and 5. Scale bar, 50 μm.

Acknowledgments
This image is the copyrighted work of the attributed author or publisher, and ZFIN has permission only to display this image to its users. Additional permissions should be obtained from the applicable author or publisher of the image. Full text @ Front Cell Dev Biol