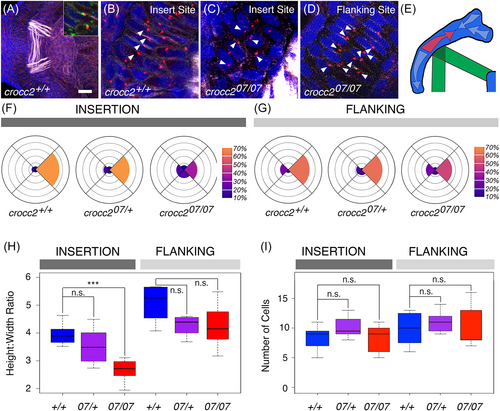
Fig. 5 Crocc2 serves to maintain planar cell polarity and regulate cell shape at the muscle insertion site. (A) Low magnification confocal projection showing muscle fibers (white, phalloidin) inserting into bilateral Meckel's cartilage (MC) elements. Individual cells are visible by staining of cortical actin at cell boundaries (white, phalloidin), and cell nuclei (blue, DAPI). Ciliary basal bodies (BBs) are labeled (red, anti-gamma-tubulin). The insert in (A) shows a high magnification of co-labeling between the ciliary axoneme label (green, anti-acetylated alpha tubulin) and BBs (red). (B-D) High magnification of muscle insertion site cells of ~72 hpf wild-type (crocc2+/+), heterozygote (crocc207/+), and crocc2 mutant (crocc207/07) larvae with white arrowheads indicating BB positions relative to each individual cell. (B) crocc2+/+ animals show BBs primarily positioned on the most proximal side of each cell. (C) At crocc207/07 muscle insertion site cells, BB positions appear to be randomized. (D) At the cells of the crocc207/07 flanking regions, BB positions are also abnormal, though not as severely affected as cells at the insertion site. Scale bar = 20 μm in (A), 7 μm in the insert, and 5 μm in (B-D). (E) Polarity map showing the characteristic orientation of PCP (arrows) across regions of MC in wild-type samples.25 Note the switch in polarity (start of red arrow) at the distal-most edge of the muscle (green) insertion site. (F, G) Circular histograms (Roseplots) with quadrants representing cell surface positions (top = rostral; bottom = caudal; right = proximal; left = distal). (F) At muscle insertion sites, the majority of wild-type (crocc2+/+) and heterozygote (crocc207/+) BBs are on the proximal side of the cell (70% and 60%, respectively), while in crocc2 mutants (crocc207/07) the polarity is more randomized (P < .001). (G) At flanking sites, BBs are oriented proximally in both wild-type (crocc2+/+) and heterozygotes (crocc207/+), and this orientation is disrupted in crocc207/07 (P = .005) albeit to a lesser degree than in insertion site cells. (H) Box plots show a significant reduction in cellular Height: Width (H:W) ratio specific to only the insertion site cells in crocc207/07 (red) relative to wild-type larvae (blue, *** = P < .0001). There was no significant difference (n.s.) in crocc2 heterozygotes (purple) relative to wild-type larvae (P = .261) at the insertion site, although the H:W ratio is intermediate relative to wild-type and mutants. In the flanking region, no significant differences were detected among genotypes. (I) Box plots show no significant differences between genotypes in cell numbers.
Image
Figure Caption
Acknowledgments
This image is the copyrighted work of the attributed author or publisher, and
ZFIN has permission only to display this image to its users.
Additional permissions should be obtained from the applicable author or publisher of the image.
Full text @ Dev. Dyn.

