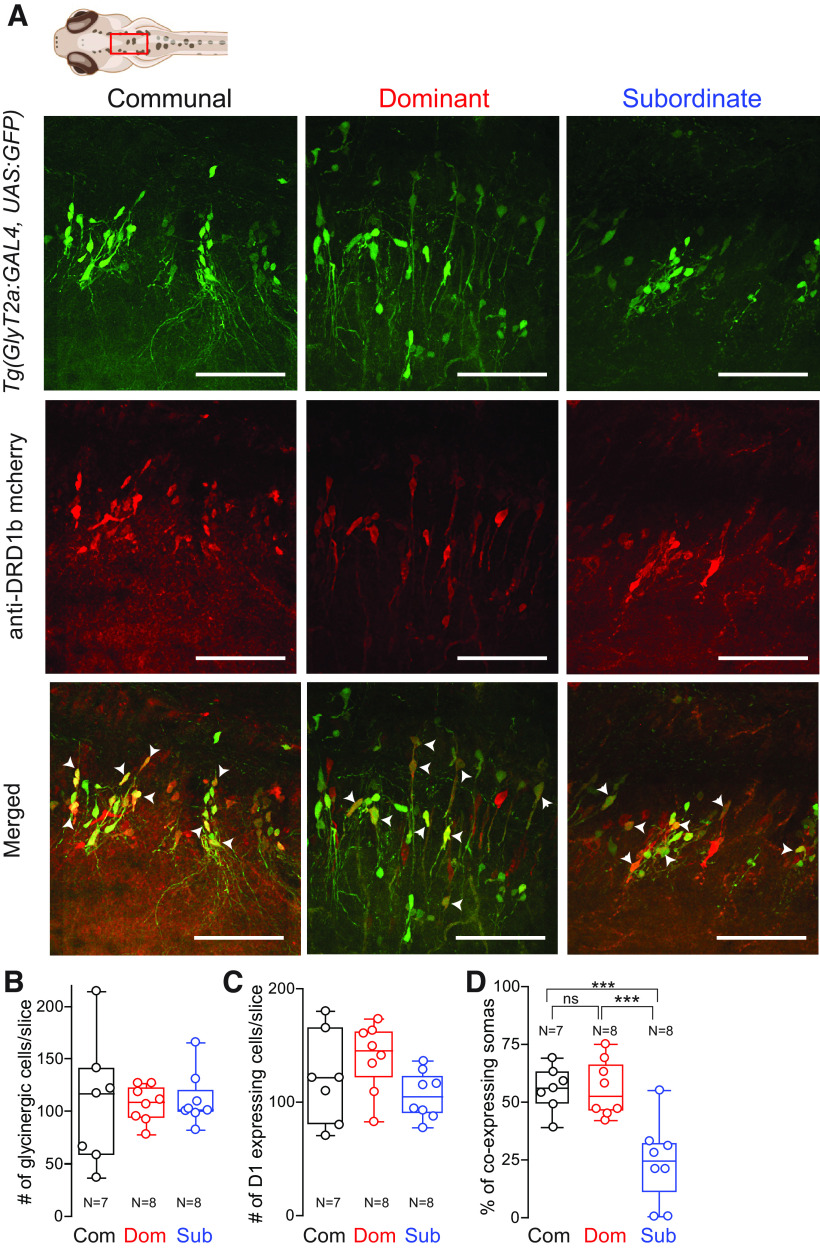
Status-dependent expression of Drd1b in hindbrain glycinergic neurons. A, Representative confocal projections of optical sections of communal, dominant, and subordinate animals. Top row, Images of glycine neurons. Second row, Drd1b staining. Third row, Glycine and Drd1b merged. Arrowheads point to co-expressing cells. Projections, Dashed lines denote midline; anterior is to the left. B–D, Comparing the numbers of glycinergic cells per brain slice (B), the numbers of D1 expressing cells per brain slice (C), and the percentage of co-expression of Drd1b and glycinergic neurons (D) among communal (n = 7), dominant (n = 8), and subordinate (n = 8) animals. We performed one-way ANOVA (between-subject factor as group) followed by Tukey’s HSD post hoc test for the group comparisons. B, There was no effect of group (F(2,20) = 2.81e-1, p > 0.05). C, There was no effect of group (F(2,20) = 2.27, p > 0.05). D, There was a significant main effect of group (F(2,20) = 1.38e+1, p = 1.73e-4). The post hoc tests showed a significant decrease in co-expression for subordinates compared with communals (p = 7.27e-4) and dominants (p = 4.79e-4). Scale bar = 50 μm.

Acknowledgments
This image is the copyrighted work of the attributed author or publisher, and
ZFIN has permission only to display this image to its users.
Additional permissions should be obtained from the applicable author or publisher of the image.
Full text @ eNeuro
Your Input Welcome
Thank you for submitting comments. Your input has been emailed to ZFIN curators who may contact you if
additional information is required.
Oops. Something went wrong. Please try again later.