IMAGE

Figure 6

ID
ZDB-IMAGE-231127-88
Source
Figures for Reinhardt et al., 2023
Image
Figure Caption

Figure 6

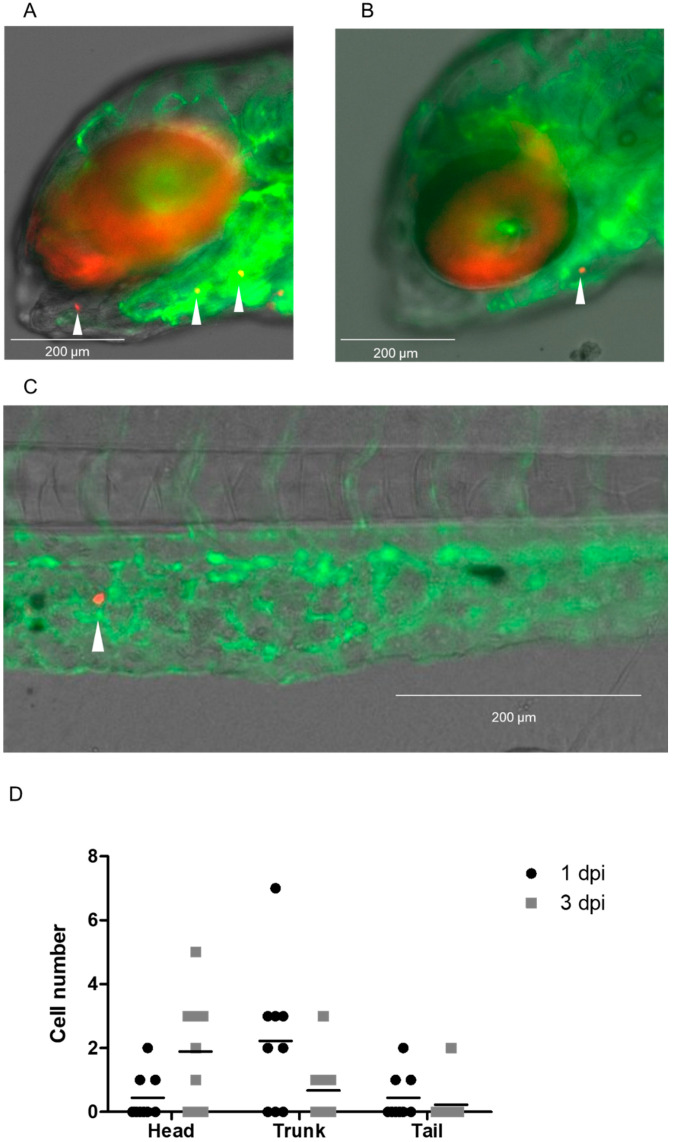
Dissemination of isolated CTCs of a MBC patient after injection with the DanioCTC workflow. Isolated CTCs, labeled in red, were monitored at 1 and 3 dpi and showed dissemination into the head, trunk and the tail. (A,B) Representative images of the head region of a Tg(kdrl:EGFP) positive embryo after injection of 50 CTCs (indicated by white arrowheads). (C) Representative image at 3 dpi showing a disseminated CTC in the CHT of an embryo (indicated by white arrowhead). (D) Absolute CTC numbers in the head, trunk and tail at 1 and 3 dpi (n = 9). dpi: days post injection. Kruskal–Wallis test followed by post hoc Dunn’s test. No statistically significant differences were observed between groups.

Acknowledgments
This image is the copyrighted work of the attributed author or publisher, and ZFIN has permission only to display this image to its users. Additional permissions should be obtained from the applicable author or publisher of the image. Full text @ Cancers