IMAGE

Figure 5

ID
ZDB-IMAGE-231127-87
Source
Figures for Reinhardt et al., 2023
Image
Figure Caption

Figure 5

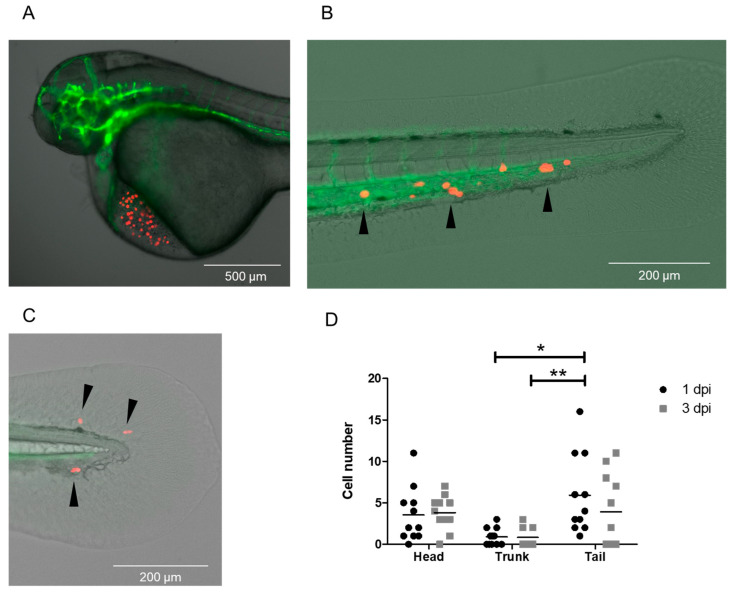
Dissemination of MDA-MB-231 cells spiked into a DLA sample after injection with the DanioCTC workflow. Cell localization was monitored at 1 and 3 dpi. (A) Representative image of 50 MDA-MB-231 cells injected into the DoC of a zebrafish embryo (1 hpi). (B) Representative image of the tail and CHT region at 3 dpi with localized MDA-MB-231 cells in the CHT (black arrowheads). (C) Representative image of the tail region at 3 dpi showing extravasated MDA-MB-231 cells (black arrowheads). (D) Absolute MDA-MB-231 cell numbers detected in the head, trunk and tail regions at 1 and 3 dpi (n = 11 embryos). Green label: endothelium; red label: MDA-MB 231 cells. dpi: days post injection. Kruskal–Wallis test followed by post hoc Dunn’s test, * 0.01 < p < 0.05; ** 0.001 < p < 0.01.

Acknowledgments
This image is the copyrighted work of the attributed author or publisher, and ZFIN has permission only to display this image to its users. Additional permissions should be obtained from the applicable author or publisher of the image. Full text @ Cancers