
Image
|
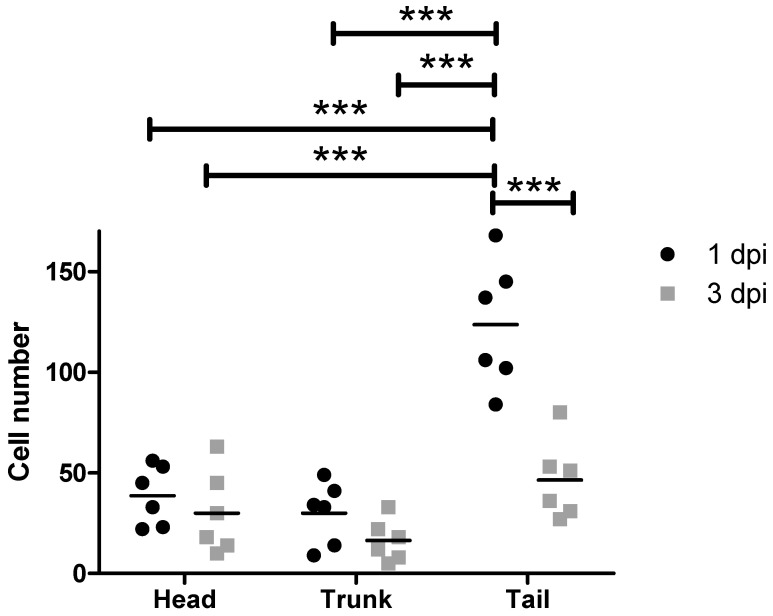
Figure Caption
Figure 4
Dissemination of MDA-MB-231 cells after injection with the standard workflow into zebrafish larvae. Depicted are the absolute MDA-MB-231 cell numbers in the head, trunk and tail at 1 and 3 dpi (n = 6). dpi: days post injection. ANOVA followed by post hoc Bonferroni test, *** 0.0001 <
Acknowledgments
This image is the copyrighted work of the attributed author or publisher, and
ZFIN has permission only to display this image to its users.
Additional permissions should be obtained from the applicable author or publisher of the image.
Full text @ Cancers