IMAGE

Fig. 2

ID
ZDB-IMAGE-231124-30
Source
Figures for Saunders et al., 2023
Image
Figure Caption

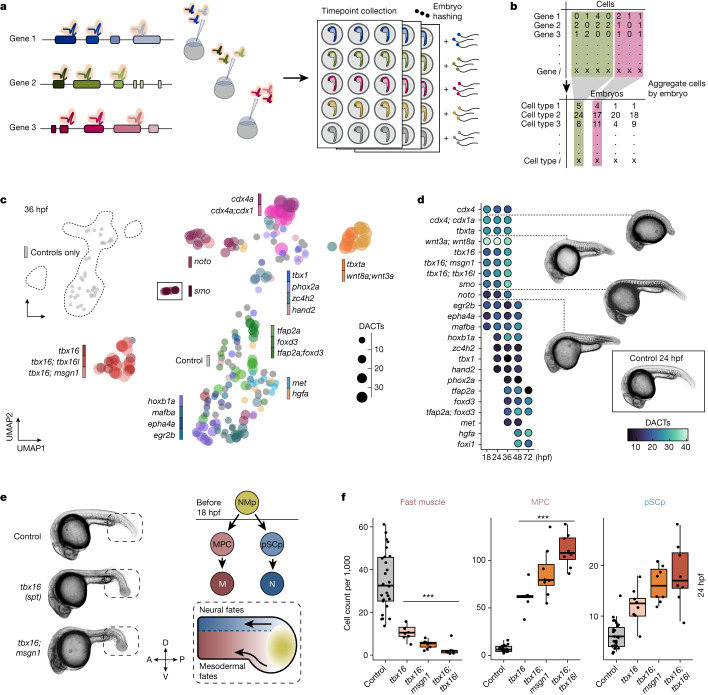
Fig. 2 High-resolution phenotyping of crispant zebrafish embryos.

a, A schematic of the experimental design. We designed two to three gRNAs across multiple exons and injected ribonucleoprotein complexes (RNPs) at the one-cell stage. Embryos were screened for phenotypes and dissociated in a 96-well plate before nuclei isolation, hashing and fixation. Partially created with BioRender.com. b, An individual by cell type matrix was constructed by tallying the number of each broad cell type recovered for each embryo. c, UMAP embedding of individual cell type composition data at 36 hpf. Embryos are coloured by genotype, and point size reflects the number of DACTs detected per genotype at 36 hpf. Control embryos are shown via inset (top left). Smoothened (smo) is shown as inset because it was distant to the other embryos. d, Heat map of DACT number for each perturbation and timepoint combination. Broad cell type annotation level (n = 99 total) was used, and abundance differences were deemed significantly different if q < 0.01 (beta-binomial regression). Images are representative siblings of collected embryos at 24–26 hpf. e, Representative images of control, tbx16 and tbx16;msgn1 crispants at 24 hpf, accompanied by a schematic of neuromesodermal differentiation in the tail bud (dashed box). NMps give rise to two anteriorly migrating lineages of cells: (1) MPCs and (2) pSCps, which give rise to somitic muscle (M) and spinal cord neurons (N), respectively. Compass denotes anatomical orientation: D, dorsal; V, ventral; A, anterior; P, posterior. f, Box plots of cell counts (per 1,000 and size-factor normalized) from individual embryos across selected cell types and genotypes 24 hpf (control n = 26, perturbed n = 8 embryos each). Thick horizontal lines show medians, box edges delineate first and third quartiles, respectively and whiskers extend to ±1.5× interquartile range. Significance (***q < 1 × 10−4, beta-binomial regression) relative to control embryos.

Source Data

Acknowledgments
This image is the copyrighted work of the attributed author or publisher, and ZFIN has permission only to display this image to its users. Additional permissions should be obtained from the applicable author or publisher of the image. Full text @ Nature