
Image
|
Figure Caption
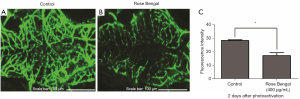
Fig. 3 Analysis of vascular endothelial cell apoptosis at pre-and post-photoactivation (after 2 days). (A) In vivo angiography of the control group, (B) in vivo angiography of photosensitizer injection group, (C) fluorescence intensity: control: 27.83±0.56 (mean ± standard deviation) photocoagulation (Rose Bengal + rhodamine): 17.28±2.08 (measured by Image J 1.52a software). *, P<0.01.
Acknowledgments
This image is the copyrighted work of the attributed author or publisher, and
ZFIN has permission only to display this image to its users.
Additional permissions should be obtained from the applicable author or publisher of the image.
Full text @ Ann Transl Med