
Image
|
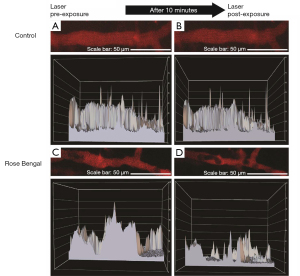
Figure Caption
Fig. 2 Real-time imaging of thrombosis in the vasculature (in vivo angiographies and blood flow chart per cross-sectional area of total vasculatures). Compared with the pre-photoactivation state (A,C), no thrombus or change of blood flow was observed at the post-activation state in the control group after photocoagulation (B), while thrombus formation and decreased blood flow were observed after photocoagulation in the Rose Bengal group (D).
Acknowledgments
This image is the copyrighted work of the attributed author or publisher, and
ZFIN has permission only to display this image to its users.
Additional permissions should be obtained from the applicable author or publisher of the image.
Full text @ Ann Transl Med