
Image
|
Figure Caption
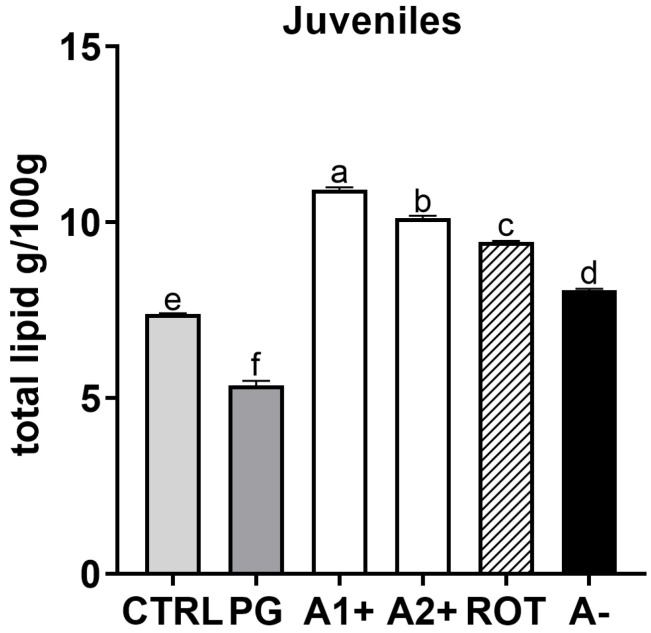
Figure 8
Total lipid content (g/100 g) of zebrafish juveniles. a–f Different letters show statistically significant differences among experimental groups (
Acknowledgments
This image is the copyrighted work of the attributed author or publisher, and
ZFIN has permission only to display this image to its users.
Additional permissions should be obtained from the applicable author or publisher of the image.
Full text @ Animals (Basel)