
Image
|
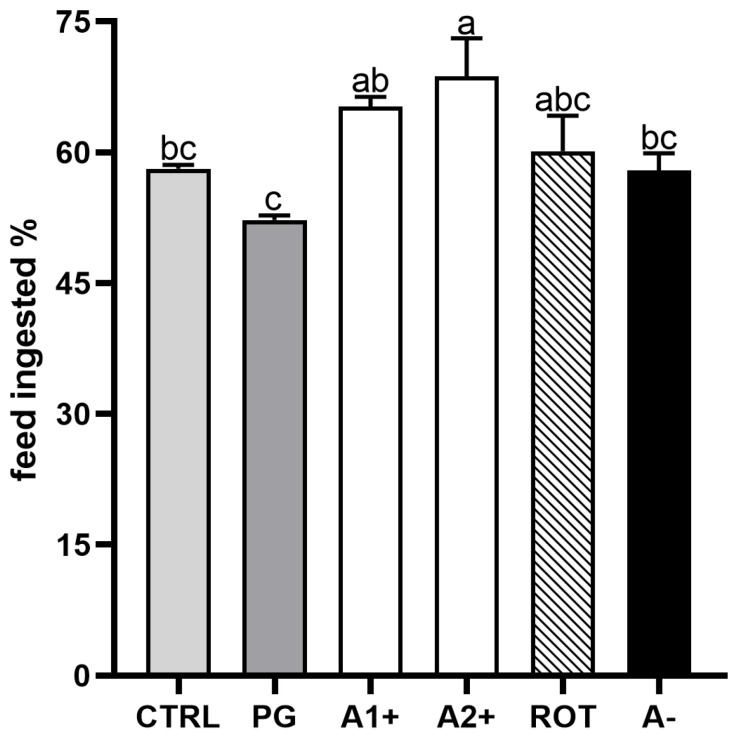
Figure Caption
Figure 2
Percentage of feed ingested after 15 min administration of experimental diets in zebrafish juveniles. Results are expressed as mean + SD (
Acknowledgments
This image is the copyrighted work of the attributed author or publisher, and
ZFIN has permission only to display this image to its users.
Additional permissions should be obtained from the applicable author or publisher of the image.
Full text @ Animals (Basel)