IMAGE

Figure EV2

ID
ZDB-IMAGE-231116-142
Source
Figures for Finotto et al., 2023
Image
Figure Caption

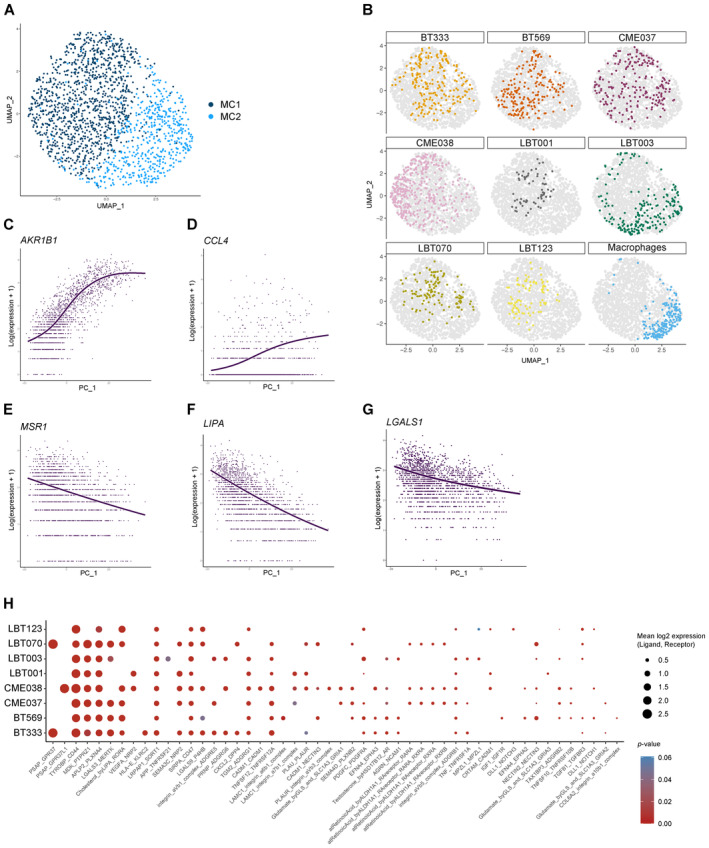
Figure EV2 Macrophages shift toward an immunosuppressive phenotype upon co‐culture with patient‐derived GSCCs

UMAP plot of macrophage population without TransMos shows two distinct macrophage subclusters (MC1‐2).

Representation of original samples on the UMAP plot.

LOESS plots for AKR1B1 (C), CCL4 (D), MSR1 (E), LIPA (F), and LGALS1 (G).

Dot plot of cell–cell communication analysis using CellPhoneDB. Depicted are L:R pairs for macrophage ‐ GSCC signaling across all GSCCs, ranked by mean log2 expression. Each dot size shows the log2 mean of expression values and dot color indicates the P‐value for the listed L:R pairs (x‐axis) in the respective GSCCs (y‐axis). Only top 50 significant L:R pairs, with cut‐offs of P‐value ≦ 0.05 are shown. The P‐values were generated by CellPhoneDB, which uses a one‐sided permutation test to compute significant interactions.

Source data are available online for this figure.

Acknowledgments
This image is the copyrighted work of the attributed author or publisher, and ZFIN has permission only to display this image to its users. Additional permissions should be obtained from the applicable author or publisher of the image. Full text @ EMBO Mol. Med.