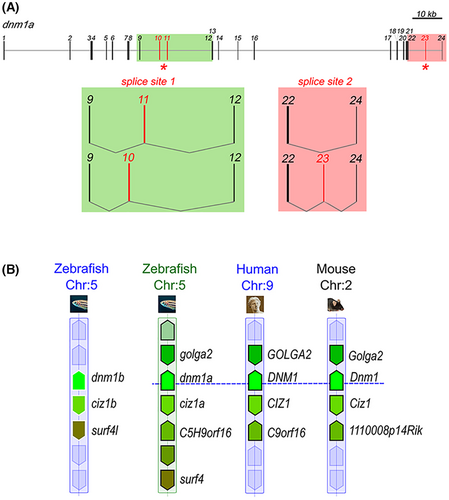
Fig. 1 dnm1a synteny and alternative splicing sites. (A) Genomic organization and transcript variants of dnm1a. In the schematics of dnm1a, exons were numbered and indicated by boxes, while introns were indicated by solid lines. Red boxes indicated alternative spliced exons. Areas containing sites of alternative splicing were highlighted in green and red. Observed events of alternative splicing were represented showing retained exons at each splice site. (B) Synteny map comparing flanking regions of dnm1 loci among zebrafish, mouse and human chromosomes (chr) was obtained through the Genomicus Phyloview browser. Genes annotated as paralogs (no surrounding line) or orthologs (with a black surrounding line) by the Ensembl database shared the same color. Syntenic genes was detected in flanking regions of both dnm1a and dnm1b, suggesting they are co-orthologs of mammalian single copies. However, genomic context of dnm1a is more similar to human DMN1 and murine Dnm1 flanking regions than dnm1b.
Image
Figure Caption
Acknowledgments
This image is the copyrighted work of the attributed author or publisher, and
ZFIN has permission only to display this image to its users.
Additional permissions should be obtained from the applicable author or publisher of the image.
Full text @ J. Neurosci. Res.

