
Fig 4
- ID
- ZDB-IMAGE-231110-13
- Publication
- Tran et al., 2023 - Testing biological actions of medicinal plants from northern Vietnam on zebrafish embryos and larvae: Developmental, behavioral, and putative therapeutical effects
- All Figures
- Figures for Tran et al., 2023
|
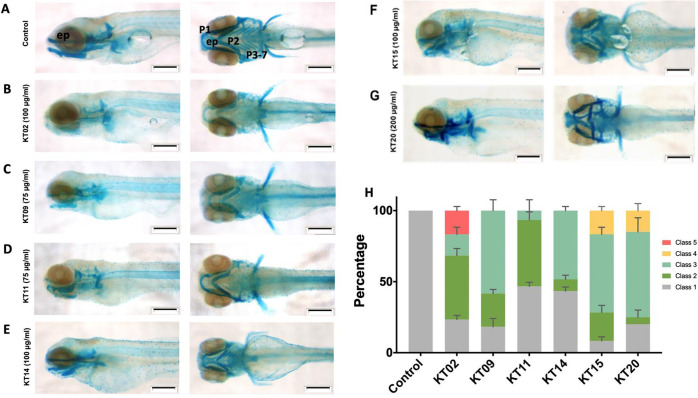
Fig 4 Medicinal plant extracts exposure affects head cartilage formation in zebrafish larvae.
Whole-mount preparations of the larva expose to extract of KT02 (B), KT09 (C), KT11 (D), KT14 (E), KT15 (F) and KT20 (G). (A) Control. Scale bar: 200 μm. (H) Statistical analysis of jaw malformations as categorized into different classes. Class 1: No observable change (Control); Class 2: Weak staining in P1 to P7 region and ethmoid plate; Class 3: Shortened jaw structure (P1, P2 and ep); Class 4: Severe structural changes in all regions; and Class 5: strongly reduced or loss of all regions. Data from three independent replicates are presented as bar graph. Abbreviations: P1: Meckel’s cartilage and palatoquadrate; P2: ceratohyal; P3-P7: ceratobranchial, and ep: ethmoid plate. Statistical analysis was performed using a two-way ANOVA test, p-values relative to control were always< 0.0001.