
|
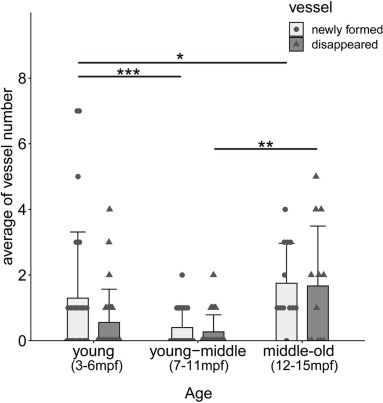
Fig. 5 Remodeling of the blood vessel patterning was observed at all ages examined. The graph shows the average number of newly formed and disappeared blood vessels in dorsal telencephalon every month. The light grey bar shows the average number of newly formed vessels compared to the previous month's data. The dark grey bar shows the average number of disappeared vessels compared to the previous month's data. Circles and triangles indicate individual values. Error bar, SD. n = 6 (3 mpf), 6 (4 mpf), 6 (5 mpf), 9 (6 mpf), 9 (7 mpf), 7 (8 mpf), 5 (9 mpf), 5 (10 mpf), 3 (11 mpf), 3 (12 mpf), 3 (13 mpf), 3 (14 mpf), 3 (15 mpf), 3 (16 mpf). *, p < 0.05, Kruskal–Wallis test and Dunn-Bonferroni post hoc test.