
|
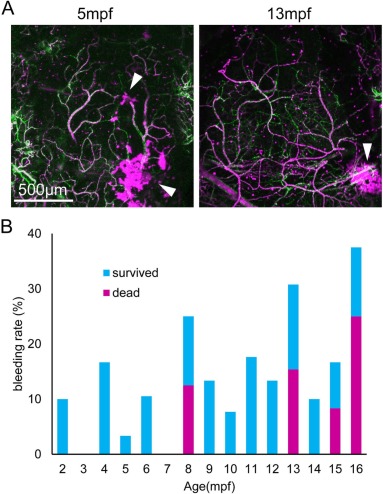
Fig. 4 Spontaneous cerebral bleeding tends to increase with aging. (A) Representative images of cerebral bleeding at 5 mpf and 13 mpf. Arrowheads indicate the bleeding site. Scale bar, 500 μm. (B) Spontaneous bleeding in the dorsal telencephalon was observed at most ages examined. Each bar indicates the percentage of fish that showed cerebral hemorrhage. Blue shows the rate of fish surviving into the next month, and magenta shows the rate of fish that died during that month. n = 10 (2 mpf), 13 (3 mpf), 12 (4 mpf), 30 (5 mpf), 19 (6 mpf), 17 (7 mpf), 16 (8 mpf), 15 (9 mpf), 13 (10 mpf), 17 (11 mpf), 15 (12 mpf), 13 (13 mpf), 10 (14 mpf), 12 (15 mpf), 8 (16 mpf). (For interpretation of the references to colour in this figure legend, the reader is referred to the web version of this article.)