
Fig. 6
- ID
- ZDB-IMAGE-231109-14
- Publication
- Yu et al., 2023 - Cell competition for neuron-derived trophic factor controls the turnover and lifespan of microglia
- All Figures
- Figures for Yu et al., 2023
|
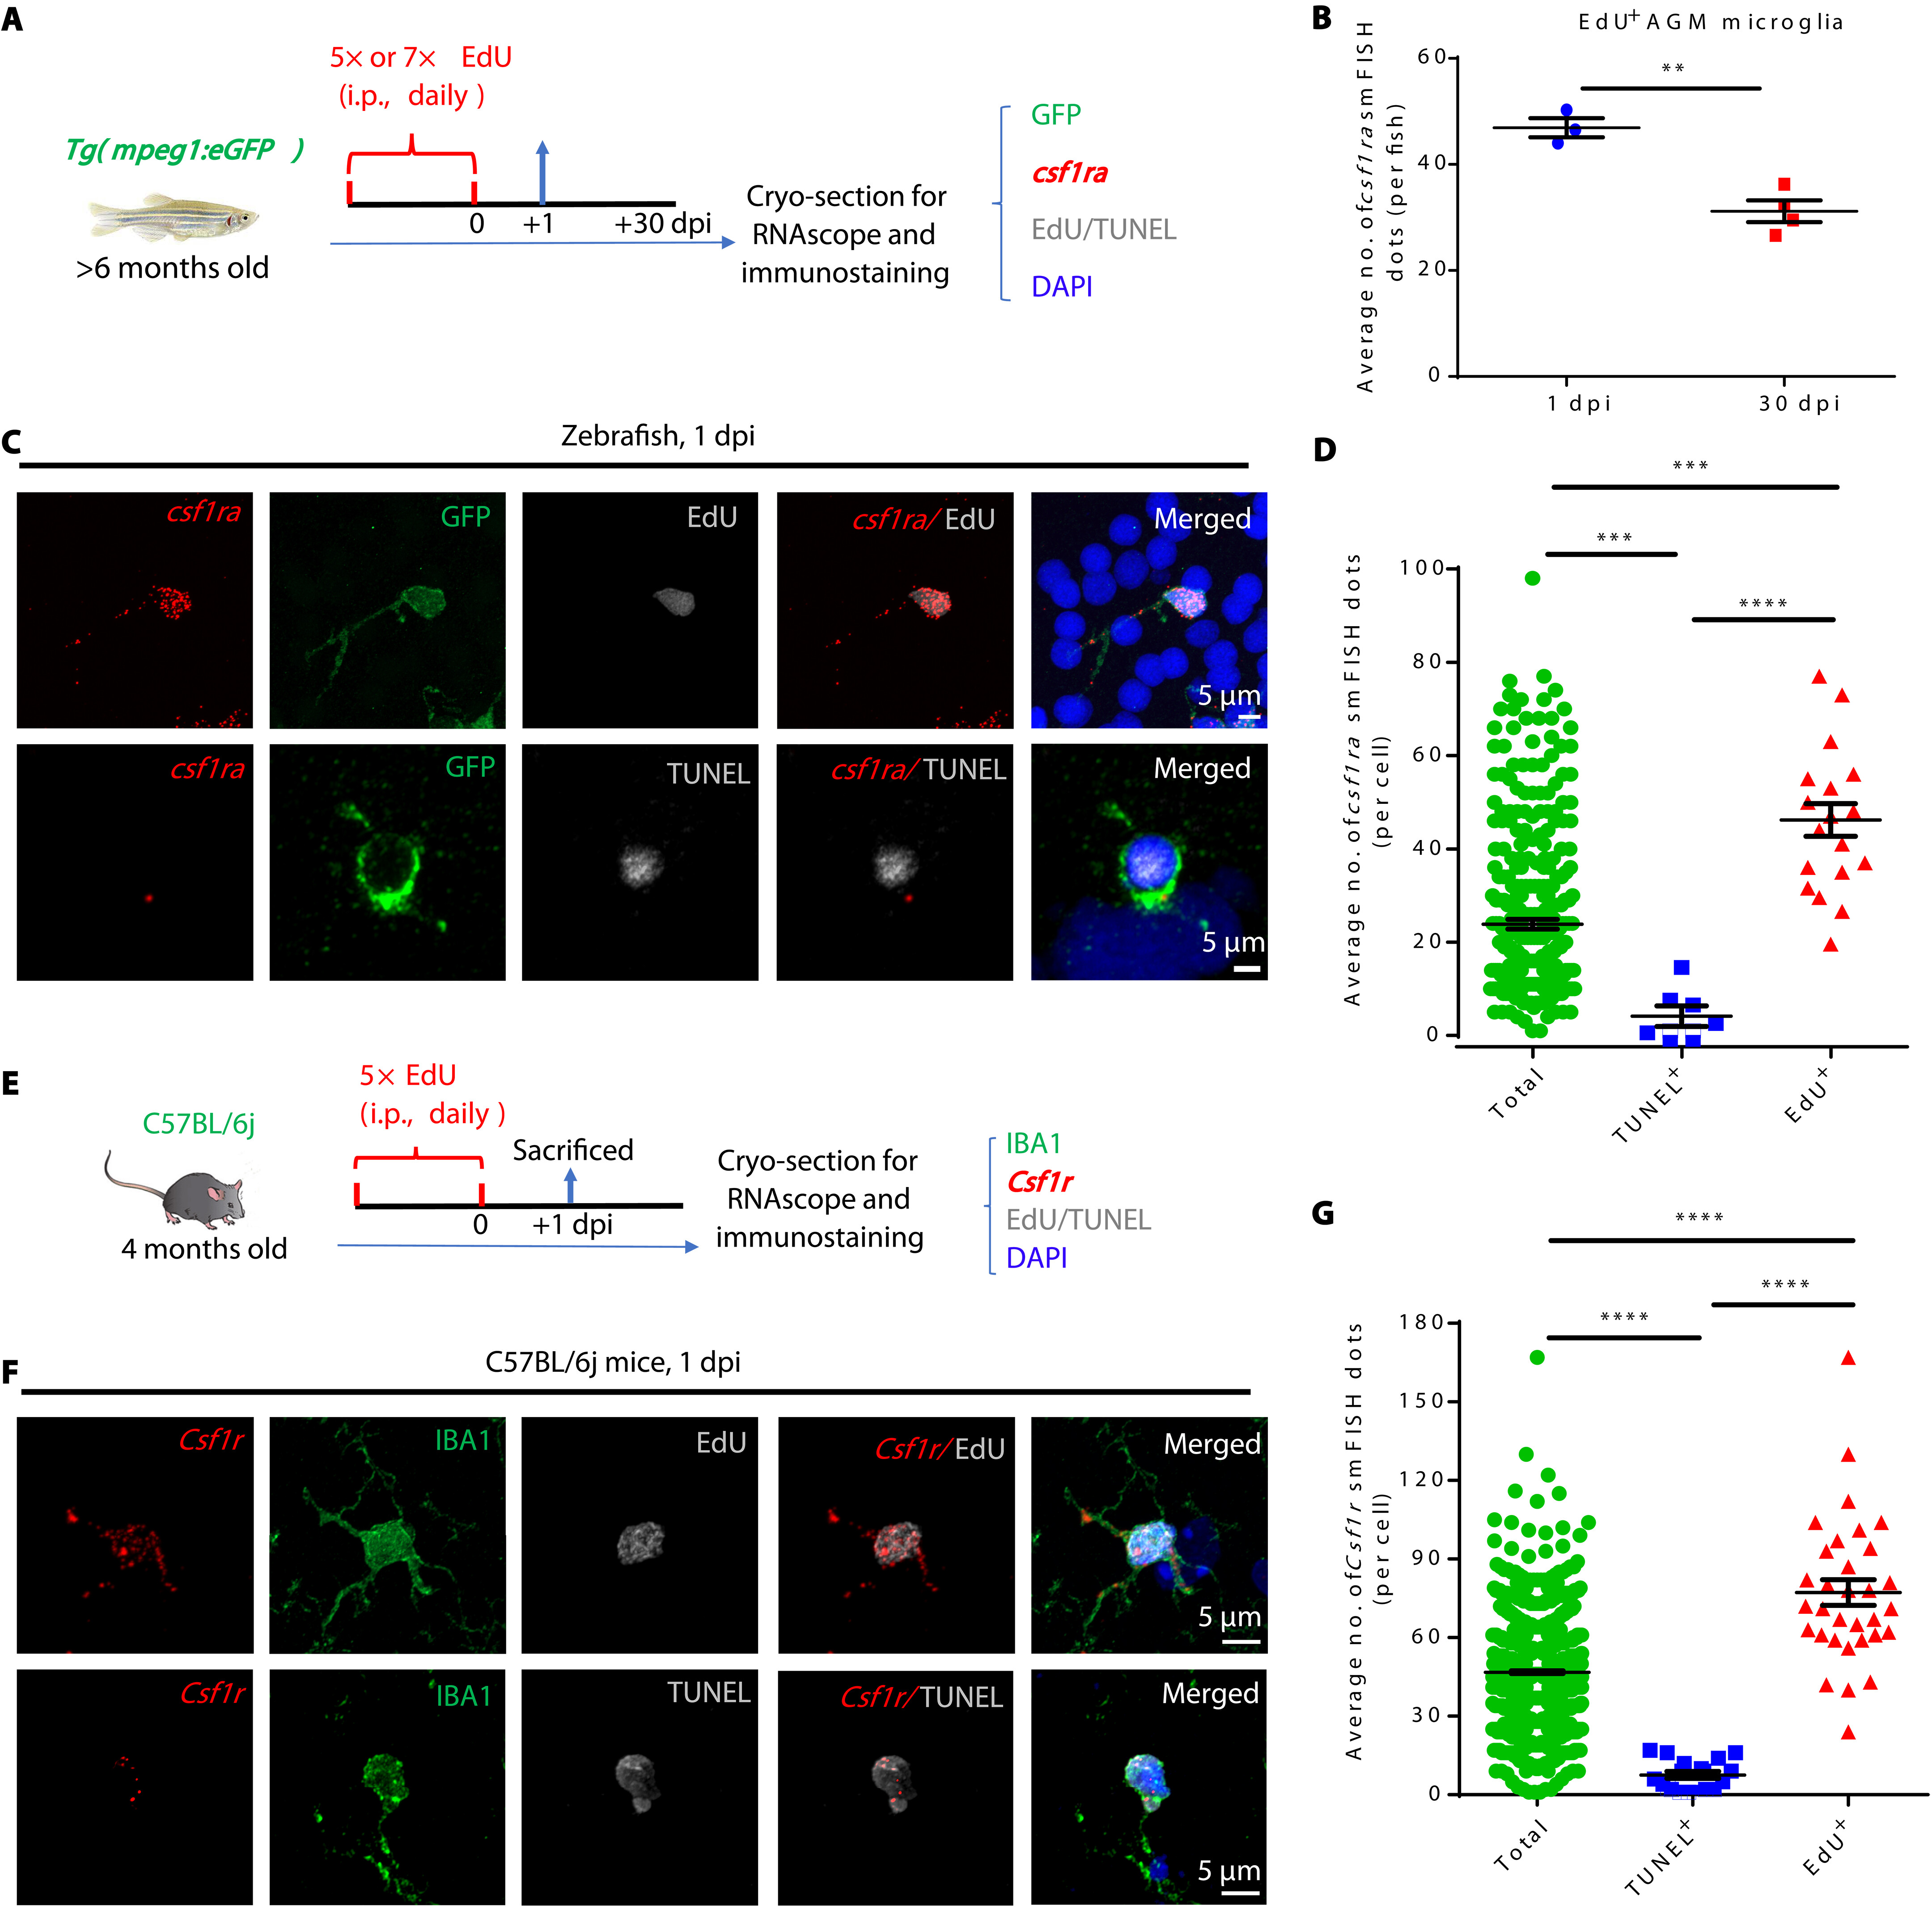
Fig. 6 Csf1ra/CSF1R level determines the fitness of adult microglia in zebrafish and mice. (A) Schematic diagram shows the experimental setup for RNAscope smFISH (red), anti-GFP/Lcp1 (green), EdU or TUNEL (white), and DAPI (blue) multicolor staining in adult zebrafish. (B) Quantification of csf1ra smFISH dots in EdU+GFP+ at 1 dpi and 30 dpi (1 dpi n = 3, 30 dpi n = 4). (C) Representative images show the expression of csf1ra in EdU+GFP+ and TUNEL+GFP+ microglia in adult zebrafish. (D) Quantification of csf1ra smFISH dots in EdU+GFP+, TUNEL+GFP+, and GFP+ (total) microglia at 1 dpi (total n = 312, TUNEL+ n = 7, EdU+ n = 18). (E) Schematic diagram shows the experimental setup for RNAscope smFISH (red), anti-IBA1 (green), EdU or TUNEL (white), and DAPI (blue) multicolor staining in adult mice. (F) Representative images show the expression of Csf1r in EdU+IBA1+ and TUNEL+IBA1+ microglia in 4-month-old C57BL/6j mice. (G) Quantification of csf1r smFISH dots in EdU+IBA1+, TUNEL+IBA1+, and IBA1+ (total) microglia shown in (F) (total n = 1348, TUNEL+ n = 18, EdU+ n = 32). **P < 0.01; ***P < 0.001; ****P < 0.0001 (Student’s t test). Data were presented as mean ± SEM.