
Fig. 3
- ID
- ZDB-IMAGE-231109-11
- Publication
- Yu et al., 2023 - Cell competition for neuron-derived trophic factor controls the turnover and lifespan of microglia
- All Figures
- Figures for Yu et al., 2023
|
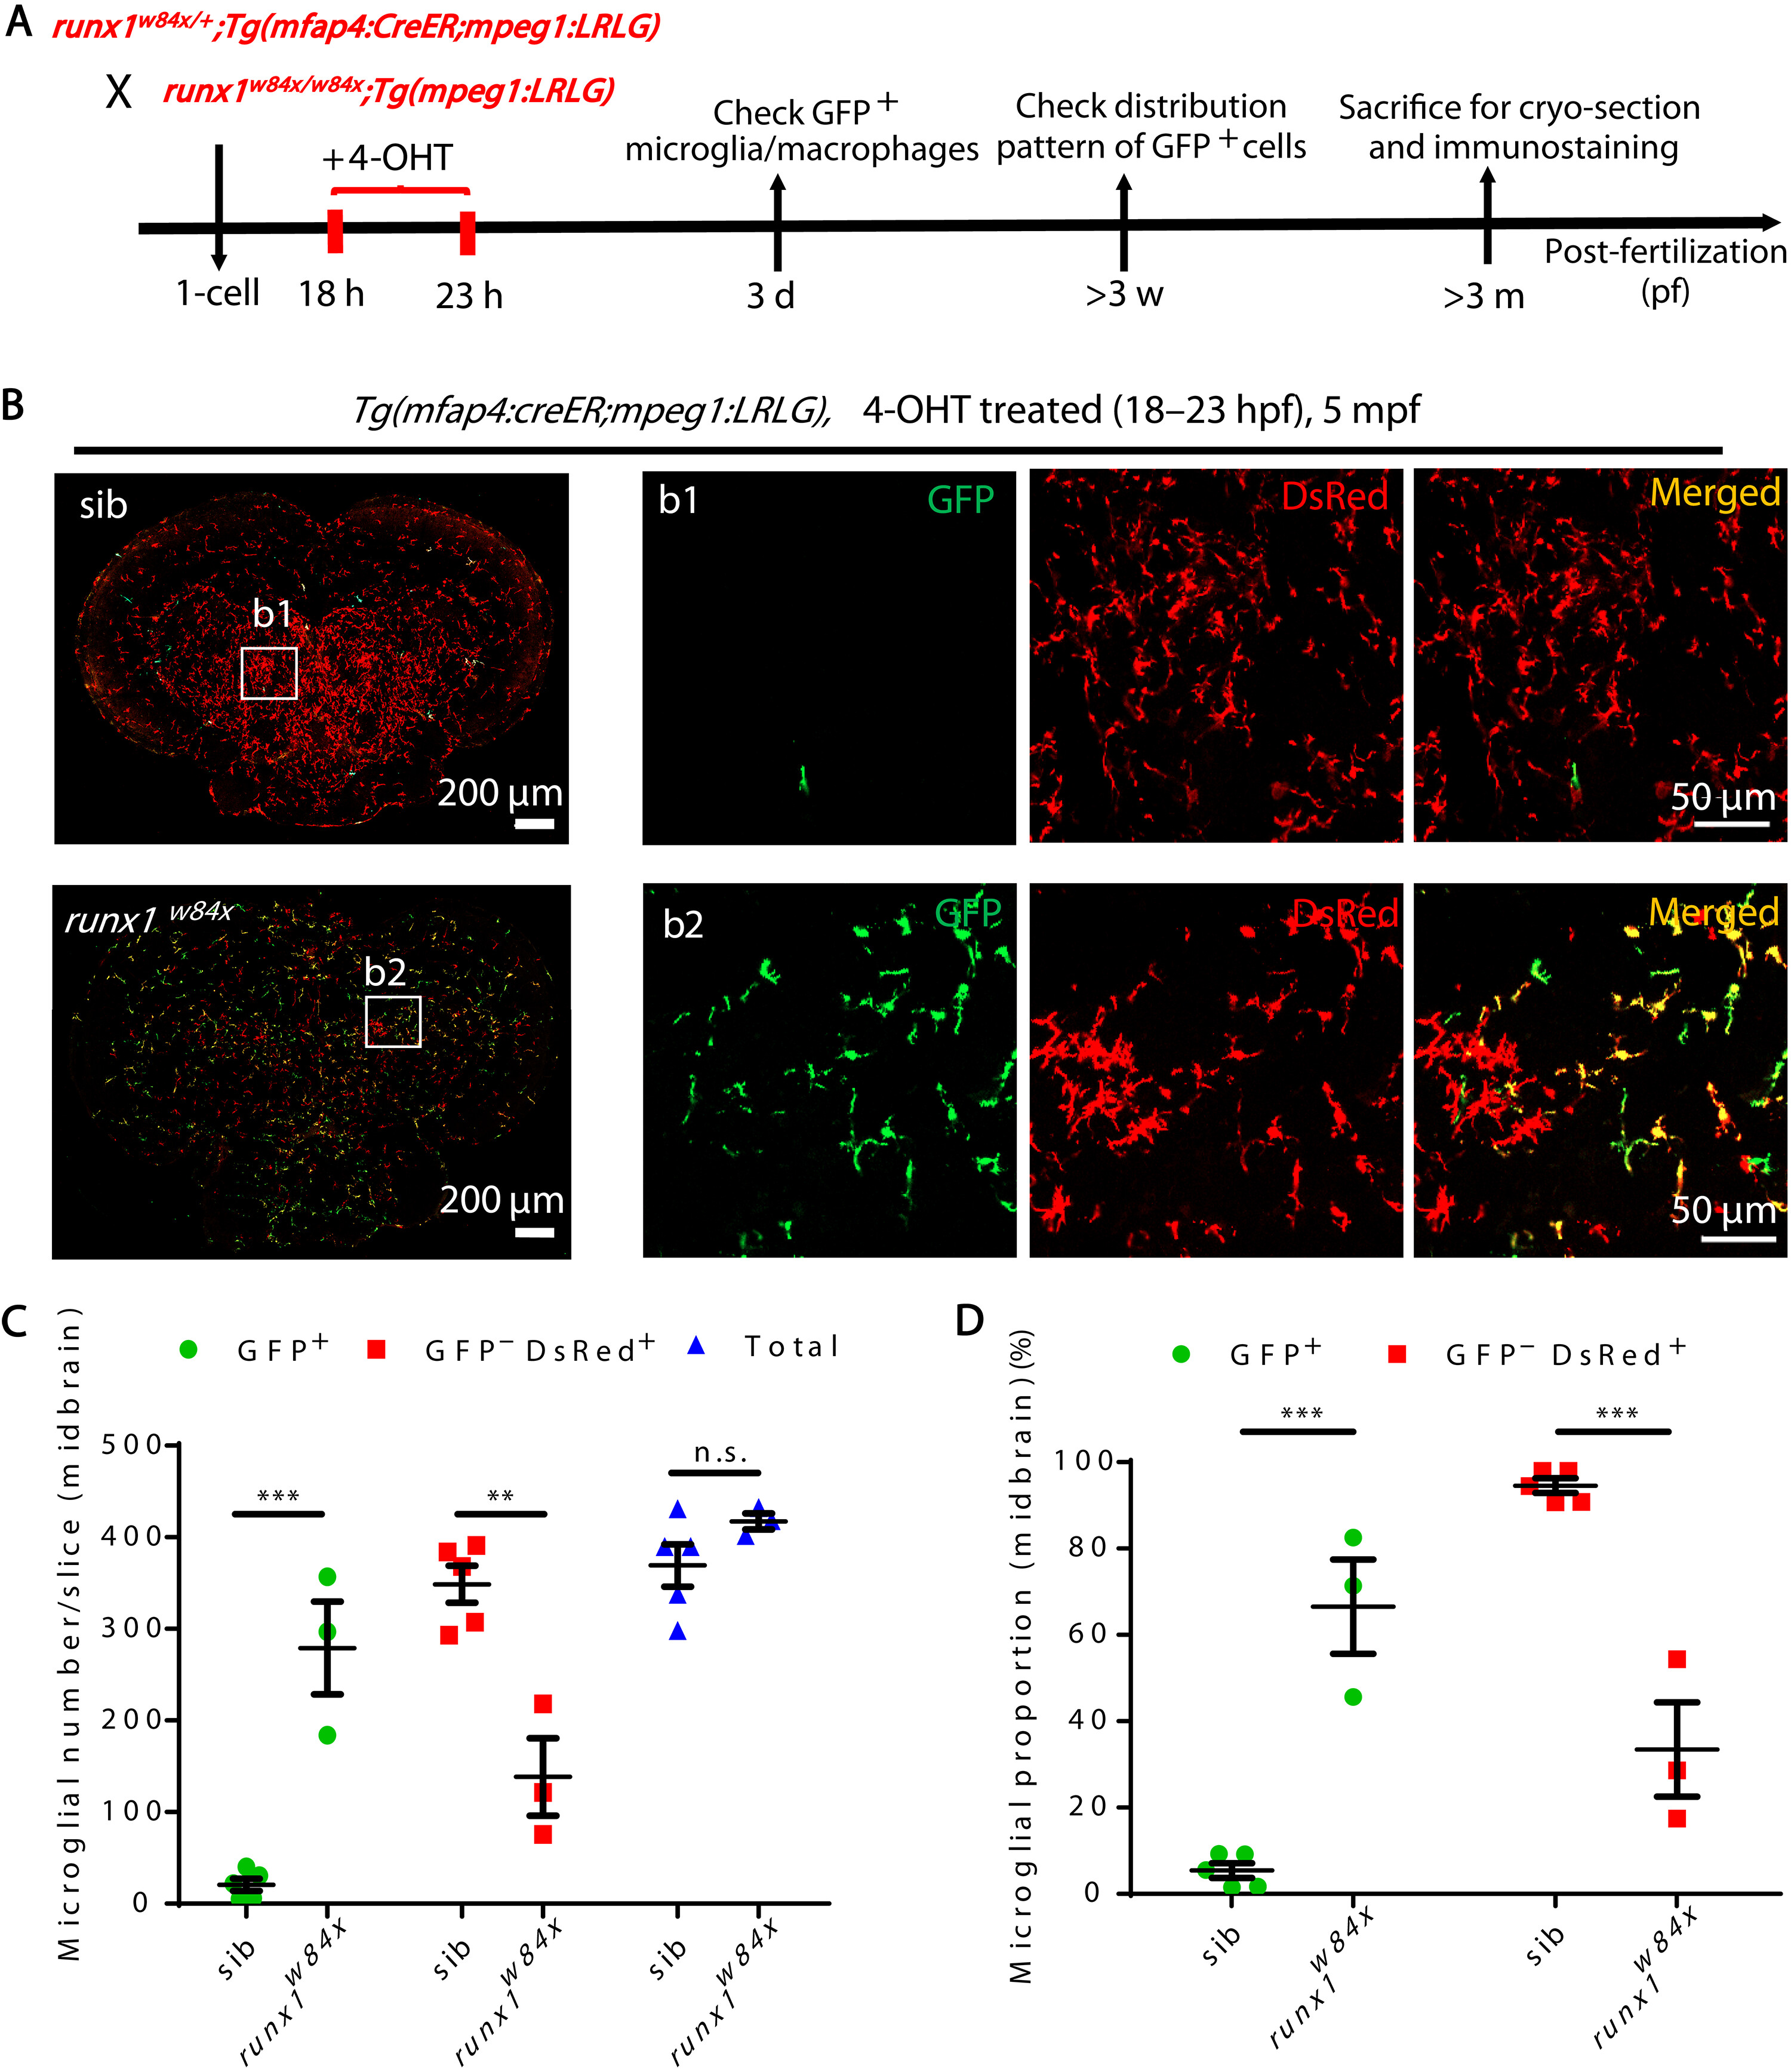
Fig. 3 Expansion and prolonged lifespan of RBI microglia in AGM microglia-deficient runx1w84x mutants. (A) Schematic diagram shows the experimental setup for the tracing of RBI microglia in siblings and runx1w84x mutants. (B) Representative images of the midbrain cross section of 4-OHT–treated Tg(mfap4:CreER;mpeg1:LRLG) siblings and runx1w84x;Tg(mfap4:CreER;mpeg1:LRLG) mutant fish at 5 mpf. GFP+ and GFP−DsRed+ cells represent RBI and AGM microglia, respectively. (C and D) Quantification of the number (C) and proportion (D) of RBI (GFP+) and AGM (GFP−DsRed+) microglia in (B). n.s., P > 0.05; **P < 0.01; ***P < 0.001 (Student’s t test). Data were presented as mean ± SEM (sibling n = 5, runx1w84x n = 3).