
Image
|
Figure Caption
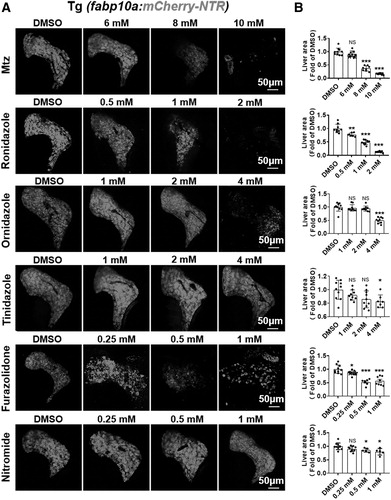
Fig. 2 Comparison of cell ablation efficiently between different Mtz analogs in Tg(fabp10a:mCherry-NTR) larvae. (A) Confocal projection images showing the liver ablation after being exposed to various concentrations for 24 h treatment at 5 dpf. (B) Quantification of the relative liver size changed after 24 h treatment. Data were analyzed by t-test. Values represent mean ± SD; *p < 0.05; **p < 0.01; ***p < 0.001. NTR, nitroreductase; NS, no significant difference; SD, standard deviation.
Acknowledgments
This image is the copyrighted work of the attributed author or publisher, and
ZFIN has permission only to display this image to its users.
Additional permissions should be obtained from the applicable author or publisher of the image.
Full text @ Zebrafish