
|
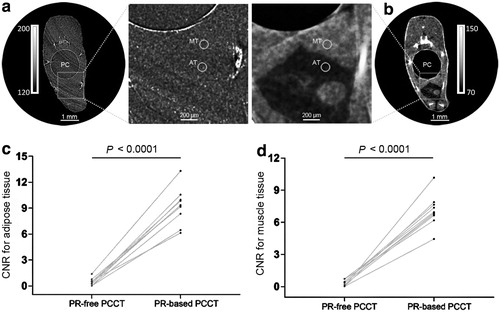
Fig. 9 Comparison of the soft tissue CNRs between PR-free PCCT and PR-based PCCT. (a, b) Are PR-free PCCT and PR-based PCCT images, respectively. Note that the adipose tissue and muscle tissue were more clearly shown on the PR-based PCCT image than on the PR-free PCCT image. The mean intensities and SDs in two ROIs with a diameter of 100 μm (dotted circles) were measured for adipose tissue and muscle tissue, respectively. The adjusted gray value scalings are given. The CNRs from PR-based PCCT were significantly higher than those from PR-free PCCT for both adipose tissue (c) and muscle tissue (d). CNRs, contrast-to-noise ratio; ROIs, region of interest; SDs, standard deviation.