
Fig. 8
- ID
- ZDB-IMAGE-231107-39
- Publication
- Demers et al., 2022 - PEX13 prevents pexophagy by regulating ubiquitinated PEX5 and peroxisomal ROS
- All Figures
- Figures for Demers et al., 2022
|
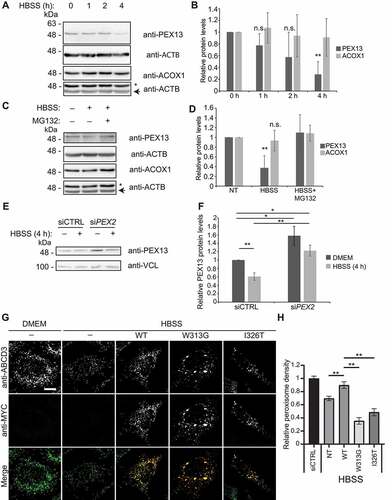
Fig. 8 PEX13 protein levels are proteasomally regulated during MTORC1 inhibited pexophagy. (A) Immunoblot analysis of HEK293 cells grown in HBSS for the indicated time, probed for PEX13, ACOX1 and ACTB/β-actin. Asterisks indicate residual ACOX1 band. (B) Quantification of relative protein levels of PEX13 and ACOX1 from (A) (n = 3). (C) Immunoblot analysis of HEK293 cells treated with HBSS and MG132 (10 μM) for 4 h as indicated, and probed for PEX13, ACOX1 and ACTB/β-actin. (D) Quantification of relative protein levels of PEX13 and ACOX1 from (C) (n = 4). (E) Immunoblot analysis of HEK293 cells treated with siCTRL and siPEX2, and HBSS as indicated and probed for PEX13 and VCL/vinculin. (F) Quantification of the relative protein levels of PEX13 in (E). (G) Immunofluorescent images of HeLa cells overexpressing the indicated PEX13-MYC constructs (green) and stained for endogenous ABCD3 (red), treated with HBSS for 24 h as indicated. (H) Quantification of peroxisome density in (G) (n = 3; >30 cells/trial). Error bars represent standard deviation. Asterisks denote p-values; **p < 0.01, ns p > 0.05. Scale bar: 10 μm.