
|
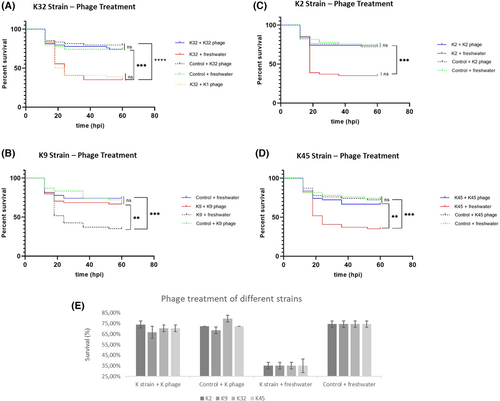
Fig. 2 Survival curves of the strains treated with phages. In (A) K32, (B) K2, (C) K9, and (D) K45 strain, the blue line shows the survival curve of each strain when the respective phage treatment was applied, while the red line shows the survival curve of each strain, when at 12 hpi the inoculum was replaced with freshwater, whereas the black dotted line shows the survival curve of not exposed individuals, treated with the phage solution, and finally the green line represents the survival of subjects that were not exposed to bacteria, being treated with freshwater. In (E), the medium survival and standard deviations for each condition are depicted, after n = 3 independent experiments; ns, non-significant; *p ≤ .05; **p ≤ .01, ***p ≤ .001, ****p ≤ .0001.