
Image
|
Figure Caption
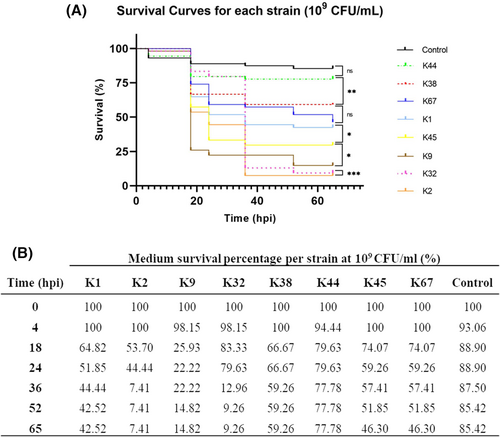
Fig. 1 Survival curves of each strain. (A) is depicted the survival curves acquired for each strain: in dotted green K44, in dotted red K38, in blue K67, in light blue K1, in yellow K45, in brown K9, in dotted pink K32, and in orange K2. The presented order matches the established virulence hierarchy. Black represents the freshwater control, where no bacteria were added. (B) represents the media survival percentage obtained in each time stamp for all the strains and controls. ns, non-significant; *p ≤ .05; **p ≤ .01, ***p ≤ .001.
Figure Data
Acknowledgments
This image is the copyrighted work of the attributed author or publisher, and
ZFIN has permission only to display this image to its users.
Additional permissions should be obtained from the applicable author or publisher of the image.
Full text @ FASEB J.