
|
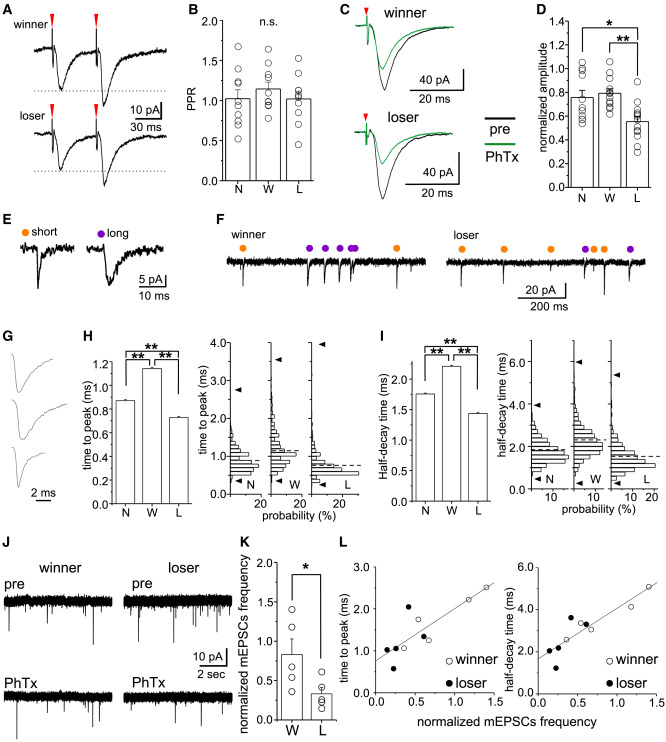
Fig. 4 Increase of GluA1 subunits in the postsynaptic membrane of ciIPN neurons in losers and its regulation by α7 nAChR (A) Examples of recorded AMPAR-eEPSCs from a winner or a loser sample evoked by a paired pulse with a 50-ms interval (red arrowheads). Scale bars, 10 pA, 30 ms. (B) Comparison of PPR among naive (N, n = 10 cells from 3 animals), winner (W, n = 10 cells, from 3 animals), and loser (L, n = 10 cells from 3 animals) groups. (C) Examples of recorded AMPAR-eEPSCs before and after the application of the homomeric GluA1 and GluA3 antagonist, PhTx (5 μM), on winner and loser slices. Scale bars, 40 pA, 20 ms. (D) Comparison of AMPAR-eEPSC peak amplitudes after PhTx application normalized with those before drug application among naive (N, n = 11 cells from 10 animals), winner (W, n = 12 cells from 11 animals), and loser (L, n = 13 cells from 12 animals) groups. (E and F) Examples of recorded AMPAR-mEPSCs from ciIPN neurons. AMPAR-mEPSCs of short and long durations were recorded from the winner and loser slices (E). Long-duration events were more frequent in ciIPN neurons of winners and short-duration events were more frequent in the losers (F). Orange and purple dots indicate short- or long-duration events. Scale bars, 5 pA, 10 ms (E) and 20 pA, 200 ms (F). (G) Examples of averaged AMPAR-mEPSCs recorded from a single cell in naive (top), winner (middle), and loser (bottom). For each trace, 100 miniature events were averaged. Amplitudes were scaled. Scale bar, 2 ms. (H and I) Comparison of time to peak (H) and half-decay time (I) of all recorded AMPAR-mEPSCs (100 events per one cell) from naive (N, n = 8 cells from 4 animals), winner (W, n = 15 cells from 9 animals), and loser (L, n = 11 cells from 6 animals) (left), and distributions of data (right). (J) The representative example of AMPAR-mEPSCs recorded from ciIPN neurons in a winner (left) or a loser (right) before (top) and after (bottom) application of PhTx (5 μM). Scale bars, 10 pA, 2 s. (K) The comparison of normalized AMPAR-mEPSC frequency between the winner (W, n = 5 cells from 5 animals) and loser (L, n = 5 cells from 5 animals). (L) The scatter plots of normalized AMPAR-mEPSC frequency versus time to peak (left) or half-decay time (right). Lines indicate the results of linear fit with all plots in the area. The sample set is the same as that in (K). Values are presented as mean ± SEM. Statistical significance was defined as ∗p < 0.05; ∗∗p < 0.01; NS, not significant, p ≥ 0.05. See also Figure S1.