
Fig. 2
- ID
- ZDB-IMAGE-231102-52
- Publication
- Sun et al., 2023 - Exposure to PFOA and its novel analogs disrupts lipid metabolism in zebrafish
- All Figures
- Figures for Sun et al., 2023
|
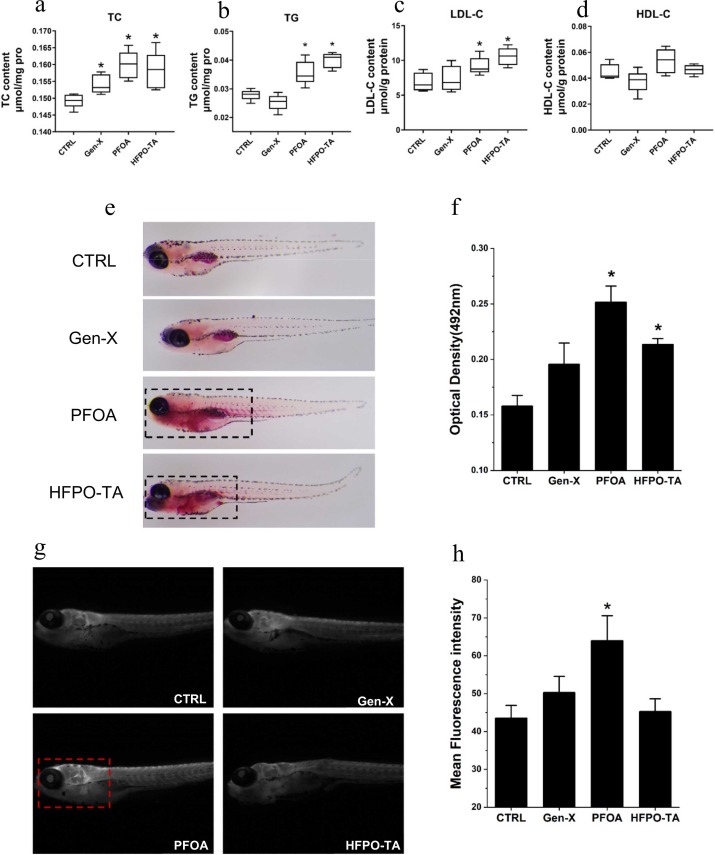
Fig. 2 Changes in lipid metabolism after 72 hpe exposure of PFOA and alternatives in zebrafish. Lipid metabolism biochemical indexes TC (a), TG (b), LDL-C (c), HDL-C (d) after exposure to PFOA and its alternatives; Representative images of neutral lipids and cholesteryl esters stained with Oil Red O (e), The box in the diagram marks the apparently positive stained section. OD 492 nm value of Oil red extracted after staining (f); Filipin staining of free cholesterol, the box in the diagram marks the apparently positive stained section (g) and image J quantification of mean fluorescence intensity (h) results were performed on exposed zebrafish. Biochemical analysis, n = 5, 40 zebrafish per group; Oil red O extraction, n = 5, 3 zebrafish per group; Filipin statistical analysis, n = 4, 4 zebrafish per group. * P < 0.05 compared with the control group. Data are expressed as mean ± SE.