
IMAGE
Fig. 3
- ID
- ZDB-IMAGE-231102-30
- Publication
- Sargent et al., 2023 - Regenerative potential and limitations in a zebrafish model of hyperglycemia-induced nerve degeneration
- All Figures
- Figures for Sargent et al., 2023
Image
|
Figure Caption
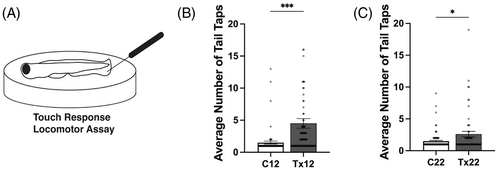
Fig. 3 Behavioral deficits remain following recovery from acute hyperglycemia. (A) Schematic describing an established touch response locomotor assay to examine escape response. Caudal fins of acclimated fish were taped until an escape response was elicited. (B) Following the treatment described in Figure 1A, a decrease in escape response was observed in Tx12 fish compared to C12, ***P = .0002. (C) Following the 10-day recovery period described in Figure 2A, decreased escape responses persisted in Tx22 fish compared to C22 fish, *P = .0171. All values are means ± SEM.
Acknowledgments
This image is the copyrighted work of the attributed author or publisher, and
ZFIN has permission only to display this image to its users.
Additional permissions should be obtained from the applicable author or publisher of the image.
Full text @ Dev. Dyn.