IMAGE

Figure 1.

ID
ZDB-IMAGE-231031-16
Source
Figures for Liu et al., 2023
Image
Figure Caption

Figure 1.

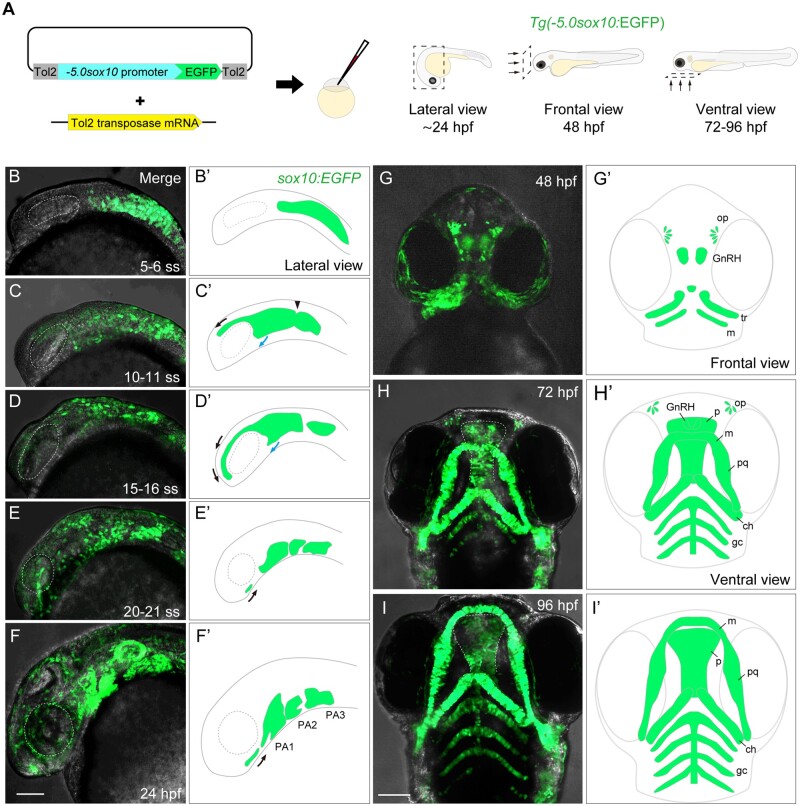
Generation and characterization of the sox10:EGFP transgenic zebrafish. (A) Schematic diagram for generating Tg(-5.0sox10:EGFP) (left) and directions of view for imaging embryos shown in (B)–(I) (right). (B–I′) Live imaging of sox10:EGFP embryos (B–I) and schematic diagram of the EGFP distribution (B′–I′). (B, B′) EGFP expression was detected at the 5–6 ss in premigratory and migratory neural crest cells. (C–E′) EGFP expression was detected in CNCCs which migrated from the anterior-most midbrain and the hindbrain to the pharyngeal pouch via frontonasal (black arrows) and maxillary (blue arrows) pathways at 10–11 ss (C, C′), 15–16 ss (D, D′) and 20–21 ss (E, E′). The arrowhead in C′ shows the midbrain-hindbrain boundary (MHB). (F, F′) EGFP-positive CNCCs formed pharyngeal arches (PAs) at 24 hpf. (G, G′) EGFP-positive CNCCs formed the primordium of craniofacial skeletal elements (the palate and lower jaw) and placodes (olfactory neurons and GnRH neurons) at 48 hpf. (H, H′) EGFP-positive CNCCs were observed in the craniofacial skeletal elements and sensory neurons at 72 hpf. (I, I′) EGFP-positive skeletal elements grew and eventually composed the face at 96 hpf. ch, ceratohyal; gc, gill cartilages; GnRH, gonadotropin-releasing hormone neuron; m, Meckel’s cartilage; op, olfactory placode; p, palate; PA, pharyngeal arch; pq, palatoquadrate; tr, trabeculae. Scale bar: 100 µm.

Acknowledgments
This image is the copyrighted work of the attributed author or publisher, and ZFIN has permission only to display this image to its users. Additional permissions should be obtained from the applicable author or publisher of the image. Full text @ Toxicol. Sci.