IMAGE

Fig. 5

ID
ZDB-IMAGE-231030-84
Source
Figures for Kolb et al., 2023
Image
Figure Caption

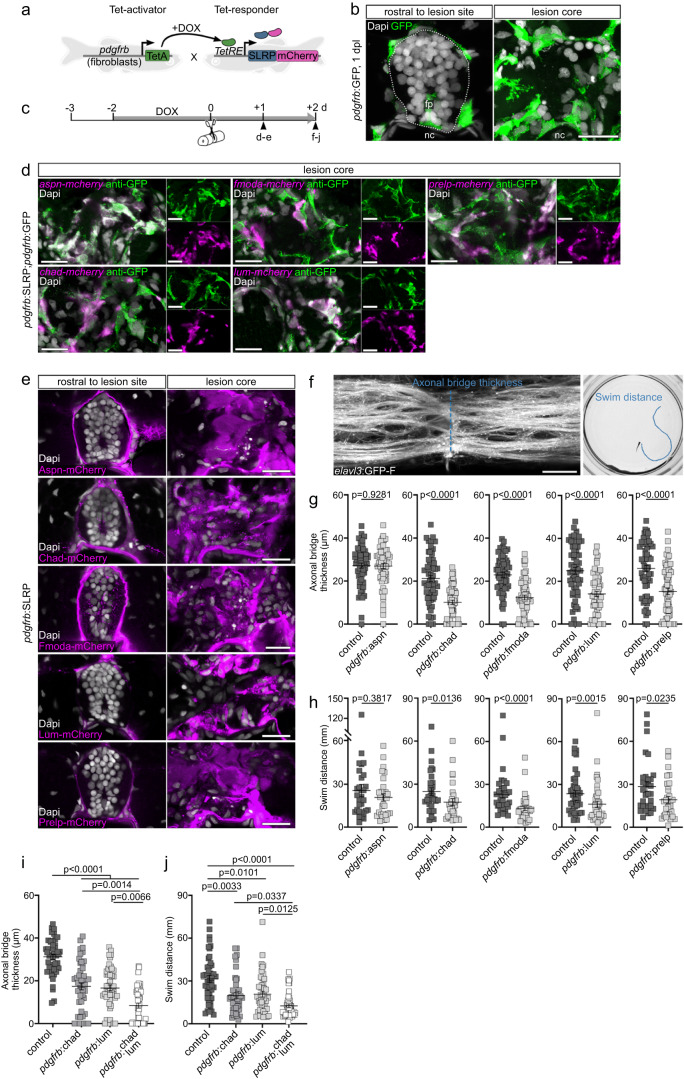
Fig. 5 SLRPs are inhibitory to CNS axon regeneration.

a Strategy to achieve pdgfrb+ fibroblast-specific expression of slrp-mCherry fusions using the TetON system. bpdgfrb+ fibroblasts (green) accumulate in the lesion core (n ≥ 10 animals)13. Dashed line indicates boundaries of the intact spinal cord. c Schematic timeline of the experimental design using the TetON system. d In the lesion core, mRNA expression of indicated slrp-mCherry fusions (magenta) is selectively induced in pdgfrb+ fibroblasts (green) in pdgfrb:TetA;TetRE:SLRP-mCherry (pdgfrb:SLRP);pdgfrb:GFP transgenic zebrafish. Similar results were obtained in n ≥ 10 animals for each experimental condition. epdgfrb+ fibroblast-specific induction of indicated slrp-mCherry fusions leads to increased mCherry fluorescence (magenta) in the lesion core. Similar results were obtained in n ≥ 10 animals for each experimental condition. fhpdgfrb+ fibroblast-specific induction of chad, fmoda, lum, and prelp but not aspn reduces the thickness of the axonal bridge (f, g) and impairs recovery of swim distance (f, h). Two-tailed Mann-Whitney test (g: Aspn, Chad; h), Two-tailed Student’s t-test (g: Fmoda, Lum, Prelp). ncontrol = 59, nAspn = 61; ncontrol = 59, nChad = 60; ncontrol = 63, nFmoda = 64; ncontrol = 60, nLum = 60; ncontrol = 60, nPrelp = 60 animals over four independent experiments (g). ncontrol = 30, nAspn = 30; ncontrol = 30, nChad = 39; ncontrol = 34, nFmoda = 32; ncontrol = 43, nLum = 43; ncontrol = 31, nPrelp = 31 animals (h). Image of the axonal bridge shown in f is a maximum intensity projection of the center of the spinal lesion site (lateral view; rostral is left). Note that neuronal somata are largely absent from the lesion core due to the acute mechanical trauma of the spinal cord transection. ij Combinatorial induction of chad and lum in pdgfrb+ fibroblasts enhances the inhibitory effect of individual SLRPs on axon regeneration (i) and recovery of swim distance (j). Kruskal-Wallis test followed by Dunn’ multiple comparison. ncontrol = 45, nChad = 48; nLum = 48; nChad+Lum = 48 animals over three independent experiments (i). ncontrol = 45, nChad = 45; nLum = 45; nChad+Lum = 45 (j). aj Each data point represents one animal. Data are means ± SEM. Images shown in b, d, and e are transversal views of the unlesioned trunk or lesion core (dorsal is up). Scale bars: 20 µm. d days, dpl days post-lesion, DOX doxycycline, fp floor plate, nc notochord. Source data are provided as a Source Data file.

Acknowledgments
This image is the copyrighted work of the attributed author or publisher, and ZFIN has permission only to display this image to its users. Additional permissions should be obtained from the applicable author or publisher of the image. Full text @ Nat. Commun.