IMAGE

Figure 5

ID
ZDB-IMAGE-231030-33
Source
Figures for da Silva et al., 2023
Image
Figure Caption

Figure 5

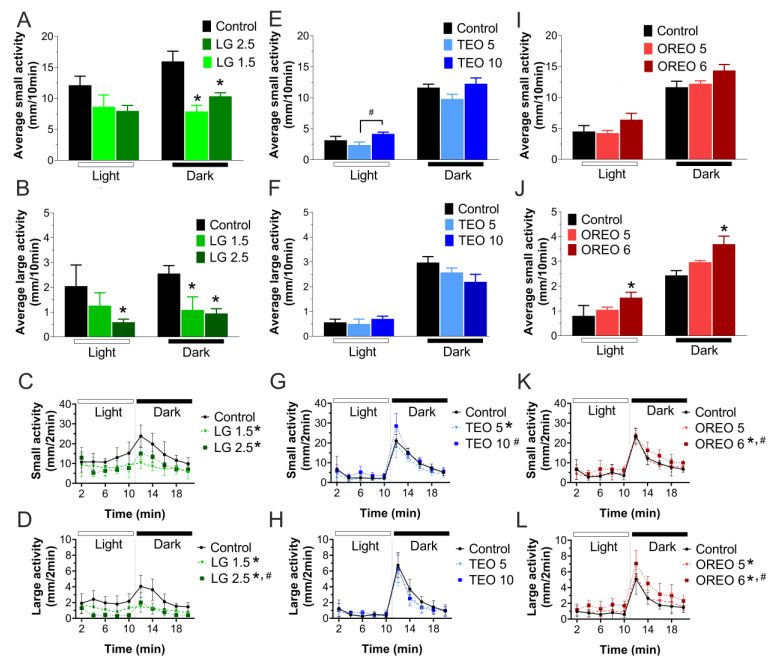
Zebrafish larvae behavior in excitatory dark–light locomotor test. (AF) Bars show the average of small (between 4 and 8 mm/s) or large (>8 mm/s) activity movement for each dark or light period (10 min). (GL) Average swimming behavior (2 min) in each complete dark–light cycle (20 min). Behavior test was analyzed by one-way ANOVA in light period (lemongrass EO small activity (F(2, 15) = 2.273, p = 0.14), large activity (F(2, 15) = 3.943, p < 0.05); thyme EO small activity (F(2, 15) = 3.463, p = 0.06), large activity (F(2, 15) = 0.5043, p = 0.61); oregano EO small activity (F(2, 15) = 1.984, p = 0.17), large activity (F(2, 15) = 4.964, p < 0.05)) and dark period (lemongrass EO small activity (F(2, 15) = 13.10, p < 0.05), large activity (F(2, 15) = 12.77, p < 0.05); thyme EO small activity (F(2, 15) = 2.829, p = 0.09), large activity (F(2, 15) = 2.547, p = 0.11); oregano EO small activity (F(2, 15) = 2.925, p = 0.08), large activity (F(2, 15) = 8.370, p < 0.05)). When the time variable was considered, two-way ANOVA test was realized in small activity: lemongrass EO small activity (F(2, 69) = 9.015, p < 0.05) and large activity (F(2, 69) = 9.924, p < 0.05); thyme EO small activity (F(2, 69) = 1.436, p = 0.24) and large activity (F(2, 69) = 0.456, p = 0.64); oregano EO small activity (F(2, 69) = 1.951, p = 0.15) and large activity (F(2, 69) = 2.746, p = 0.07). * Represents statistically significant (p < 0.05) difference by control group. # Represents statistically significant (p < 0.05) difference by another essential-oil group.

Acknowledgments
This image is the copyrighted work of the attributed author or publisher, and ZFIN has permission only to display this image to its users. Additional permissions should be obtained from the applicable author or publisher of the image. Full text @ Biomedicines