IMAGE

Figure 1

ID
ZDB-IMAGE-231030-103
Source
Figures for Huttner et al., 2023
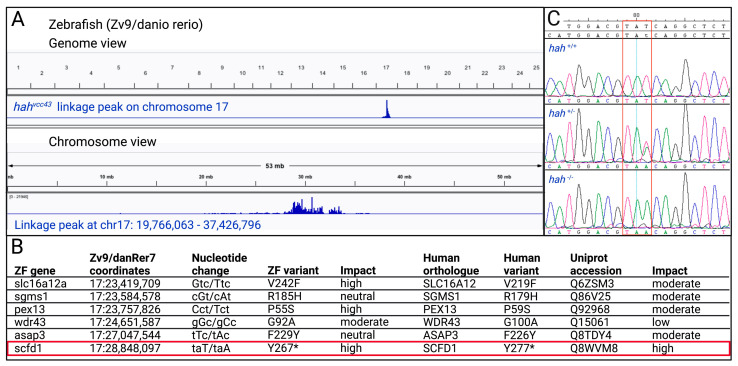
Image
Figure Caption

Figure 1

Mapping of zebrafish (ZF) hahvcc43 mutant. (A) Mapping of ENU mutagenesis-induced hahvcc43 mutant to a locus on chromosome 17. The top panel shows the genome view and the bottom panel shows the chromosome view of linkage peak. (B) Candidate gene variants in linkage interval, with scfd1 variant highlighted in red box. Human variants based on full length transcripts in Ensembl. Predicted impact of amino acid variants assessed using SIFT, PMut, PolyPhen-2, and SNPs&GO. (C) Sanger sequencing confirms taT > taA codon change (red box) in ZF scfd1 gene in heterozygous (+/−) and homozygous (−/−) hahvcc43 mutants. Created with BioRender.com.

Acknowledgments
This image is the copyrighted work of the attributed author or publisher, and ZFIN has permission only to display this image to its users. Additional permissions should be obtained from the applicable author or publisher of the image. Full text @ J Cardiovasc Dev Dis