IMAGE

Figure 3

ID
ZDB-IMAGE-231027-17
Source
Figures for Kim et al., 2023
Image
Figure Caption

Figure 3

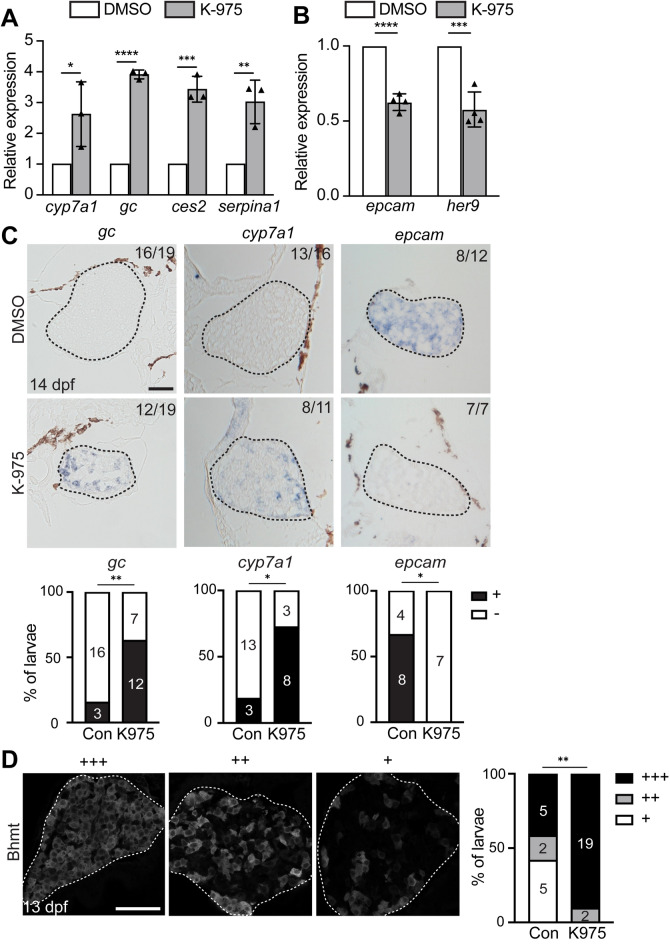
Suppression of YAP signaling promotes LPC-mediated liver regeneration, similar to PPARα activation. (AB) qRT-PCR data showing the relative expression levels of hepatocyte (cyp7a1, gc, serpina1, ces2) and BEC (her9, epcam) markers and YAP target genes (ccn1, ccn2) between DMSO- and K-975-treated Tg(fabp10a:pt-β-catenin) livers at 14 dpf. (C) Section in situ hybridization images showing the expression of hepatocyte (cyp7a1, gc) and BEC (epcam) markers in K-975-treated Tg(fabp10a:pt-β-catenin) livers at 14 dpf. For quantification, larvae were grouped into +/− based on gene expression levels. Numbers in the upper right corner indicate the proportion of larvae exhibiting the phenotype shown. (D) Immunofluorescence images showing Bhmt expression in 13-dpf Tg(fabp10a:pt-β-catenin) livers treated with K-975. Based on the level of Bhmt expression, larvae were divided into three groups: +++/++/+. Data are represented as mean ± SD (AB). ns not significant; *P < 0.05, **P < 0.01, ***P < 0.001, ****P < 0.0001; statistical significance was calculated using an unpaired two-tailed t-test (AB), Fisher’s exact test (C), and chi-square test (D). Dashed lines outline the livers (CD). Scale bars, 50 μm.

Acknowledgments
This image is the copyrighted work of the attributed author or publisher, and ZFIN has permission only to display this image to its users. Additional permissions should be obtained from the applicable author or publisher of the image. Full text @ Sci. Rep.