
Image
|
Figure Caption
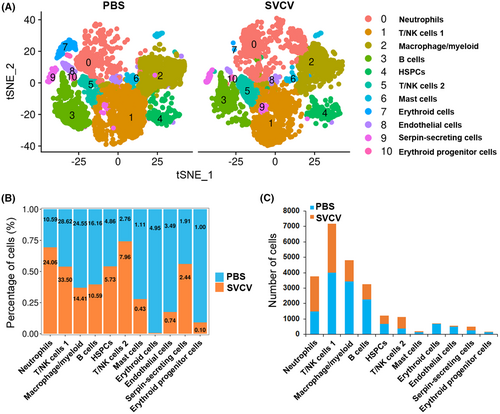
Fig. 9 Change in zebrafish spleen immune cell categories in response to SVCV infection. (A) tSNE nonlinear clustering was used to visualize the differences in the classification results of the populations of zebrafish spleen leukocytes between the control group (PBS) and the SVCV-infected group. (B) Histogram showing the differences in cell ratios between the control group and the SVCV-infected group. (C) Histogram presenting the differences in the cell numbers of each cluster between the control group and the SVCV-infected group.
Acknowledgments
This image is the copyrighted work of the attributed author or publisher, and
ZFIN has permission only to display this image to its users.
Additional permissions should be obtained from the applicable author or publisher of the image.
Full text @ FASEB J.